. 2010 May 27;6(5):e1000917.
doi: 10.1371/journal.ppat.1000917.

Perforin expression directly ex vivo by HIV-specific CD8 T-cells is a correlate of HIV elite control

Affiliations

Perforin expression directly ex vivo by HIV-specific CD8 T-cells is a correlate of HIV elite control

Adam R Hersperger et al. PLoS Pathog. .

Abstract

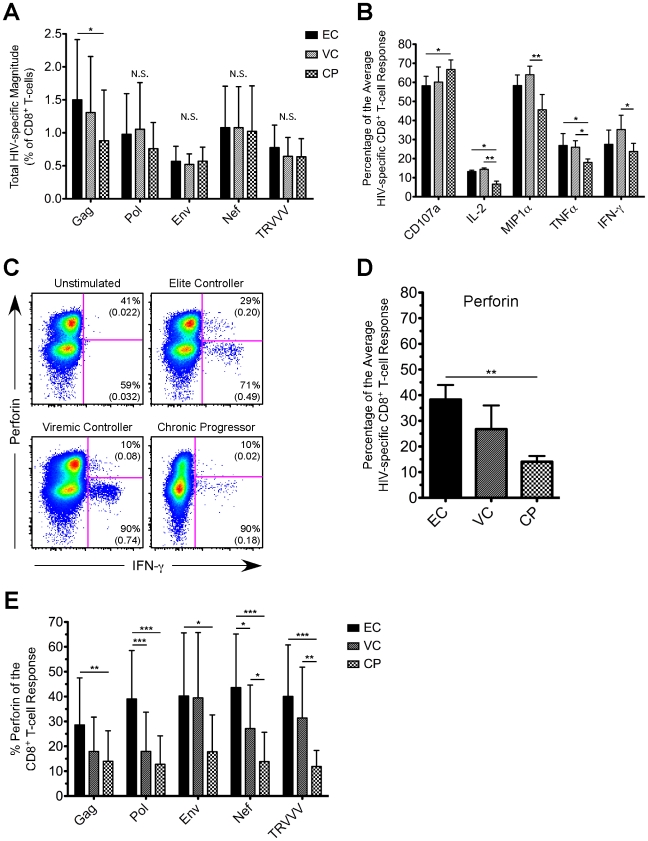
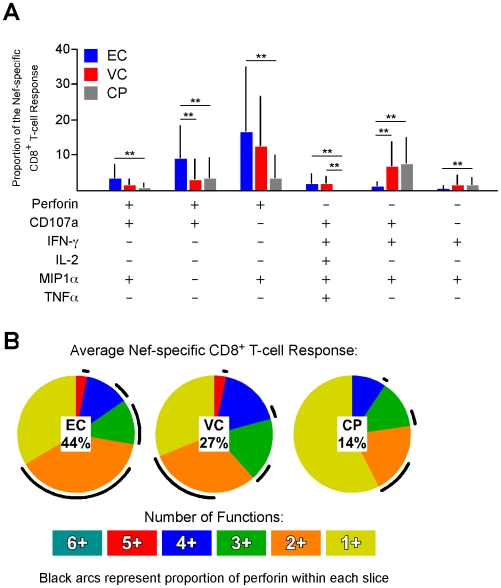
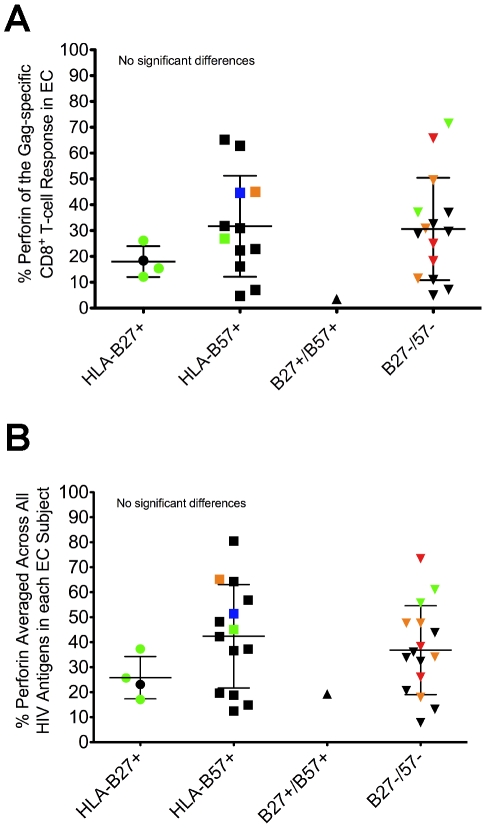
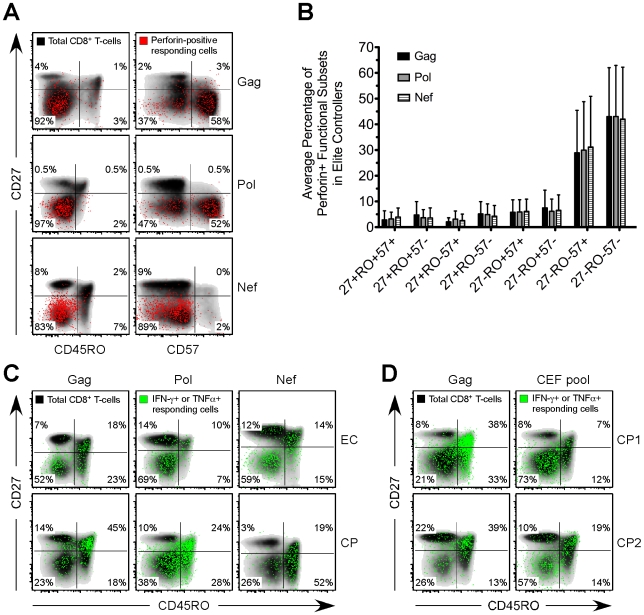
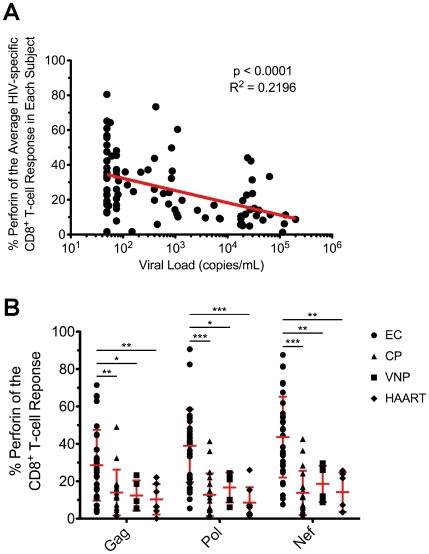
Many immune correlates of CD8(+) T-cell-mediated control of HIV replication, including polyfunctionality, proliferative ability, and inhibitory receptor expression, have been discovered. However, no functional correlates using ex vivo cells have been identified with the known ability to cause the direct elimination of HIV-infected cells. We have recently discovered the ability of human CD8(+) T-cells to rapidly upregulate perforin--an essential molecule for cell-mediated cytotoxicity--following antigen-specific stimulation. Here, we examined perforin expression capability in a large cross-sectional cohort of chronically HIV-infected individuals with varying levels of viral load: elite controllers (n = 35), viremic controllers (n = 29), chronic progressors (n = 27), and viremic nonprogressors (n = 6). Using polychromatic flow cytometry and standard intracellular cytokine staining assays, we measured perforin upregulation, cytokine production, and degranulation following stimulation with overlapping peptide pools encompassing all proteins of HIV. We observed that HIV-specific CD8(+) T-cells from elite controllers consistently display an enhanced ability to express perforin directly ex vivo compared to all other groups. This ability is not restricted to protective HLA-B haplotypes, does not require proliferation or the addition of exogenous factors, is not restored by HAART, and primarily originates from effector CD8(+) T-cells with otherwise limited functional capability. Notably, we found an inverse relationship between HIV-specific perforin expression and viral load. Thus, the capability of HIV-specific CD8(+) T-cells to rapidly express perforin defines a novel correlate of control in HIV infection.


Conflict of interest statement

The authors have declared that no competing interests exist.

Figures

Figure 1
Figure 1. HIV-specific CD8+ T-cells in EC demonstrate an enhanced ability to express perforin compared to CP.
(A) The CD8+ T-cell response magnitude to all HIV peptide pools was calculated for EC, VC, and CP and plotted as percent of CD8+ T-cells (excluding naïve cells). The total magnitude was calculated by summing across all functional combinations. (A) The proportion of the average HIV-specific CD8+ T-cell response comprised of each single functional parameter (except perforin) is shown for EC, VC, and CP. (C) Representative flow cytometric plots of perforin versus IFN-γ are shown from one representative EC, VC, and CP. Percentages represent the proportion of functional cells that stain either positive or negative for perforin. Values in parentheses are the magnitude of each population and denote percent of CD8+ T-cells (excluding naïve cells). All reported values have been corrected for background. (D) The proportion of the average HIV-specific CD8+ T-cell response comprised of perforin is shown for EC, VC, and CP. (E) The relative contribution of perforin to the Gag-, Pol-, Env-, Nef-, and TRVVV-specific CD8+ T-cell responses is shown for EC, VC, and CP. (A, B, D, E) Statistical analysis was carried out using one-way ANOVA tests (nonparametric; Kruskal-Wallis) followed by a Dunns test for multiple comparisons. * denotes a p value <0.05, ** denotes a p value<0.01, and *** denotes a p value <0.001. All bars represent the mean and error bars indicate the standard deviation.
Figure 2
Figure 2. The majority of perforin expression comes from cells with otherwise limited functional capability.
(A) The functionality of the average Nef-specific CD8+ T-cell response is shown; only the functional permutations that varied significantly between at least two of the groups are shown. ** denotes a p value <0.01 based on a Lachenbruch's Two-part Wilcoxon test as described in the Methods. All bars represent the mean and error bars indicate the standard deviation. (B) The average Nef-specific CD8+ T-cell functional profile is shown for EC, VC, and CP. Responses are grouped according to the number of positive functions. The relative amount of perforin positivity within each functional group (i.e. each pie slice) is depicted as black arcs. The relative contribution of perforin (mean value) to the entire response is represented by the percentage in the center of each pie.
Figure 3
Figure 3. Perforin expression is not restricted to the presence of protective HLA-B alleles.
EC were stratified based on the expression of HLA-B alleles previously shown to be associated with improved clinical outcomes. The relative amount of perforin expression is shown for the (A) Gag-specific and (B) average HIV-specific CD8+ T-cell responses among all EC. Each symbol represents an individual study subject. Some of the symbols are colored to denote the presence of another protective HLA-B allele: blue, HLA-B13; green, HLA-B15; orange, HLA-B51; red, HLA-B58. No statistically significant differences were found between the groups using a one-way ANOVA test (nonparametric; Kruskal-Wallis) followed by a Dunns test for multiple comparisons. The error bars represent the mean and standard deviation.
Figure 4
Figure 4. Distinct expansion of HIV-specific effector CD8+ T-cells in EC.
(A) Gag-, Pol-, and Nef-specific perforin+ functional subsets (red events) were overlaid onto a density plot (black shading) of the memory phenotype, as determined by CD27, CD45RO, and CD57, of the total CD8+ T-cell population in three representative EC subjects. (B) The memory phenotype of Gag-, Pol-, and Nef-specific perforin+ functional subsets, as determined by CD27, CD45RO, and CD57, was determined for all EC. Bars represent the mean and error bars indicate the standard deviation. (C) Gag-, Pol-, and Nef-specific CD8+ T-cells, as defined by the production of IFN-γ or TNFα (green events), were overlaid onto a density plot (black shading) of the memory phenotype, as determined by CD27 and CD45RO, of the total CD8+ T-cell population in three separate EC and CP subjects. (D) Gag- and CEF-specific CD8+ T-cells, as defined by the production of IFN-γ or TNFα (green events), were overlaid onto a density plot (black shading) of the memory phenotype, as determined by CD27 and CD45RO, of the total CD8+ T-cell population in two separate CP subjects. (A, C, D) Percentages represent the fraction of overlaid cells that fall within each quadrant.
Figure 5
Figure 5. Inverse relationship between viral load and HIV-specific perforin expression, which is not rescued by HAART.
(A) The average proportion of HIV-specific perforin expression within each subject was plotted against the HIV viral load from each respective subject. The most proximal viral load measurement to the time point of the PBMC sample was used in the analysis. Spearman correlation tests (nonparametric; two-tailed) were performed to determine statistical significance. (B) The relative contribution of perforin to the Gag-, Pol-, and Nef-specific CD8+ T-cell responses is shown for all EC, CP, VNP, and HAART-suppressed subjects. Each symbol represents an individual study subject. One-way ANOVA tests (nonparametric; Kruskal-Wallis test) were performed followed by a Dunns test for multiple comparisons. * denotes a p value <0.05, ** denotes a p value <0.01, and *** denotes a p value <0.001. The error bars represent the mean and standard deviation.

Similar articles

Cited by

References

    1. Lambotte O, Boufassa F, Madec Y, Nguyen A, Goujard C, et al. HIV controllers: a homogeneous group of HIV-1-infected patients with spontaneous control of viral replication. Clin Infect Dis. 2005;41:1053–1056. - PubMed
    1. Lefrere JJ, Mariotti M, Morand-Joubert L, Thauvin M, Roudot-Thoraval F. Plasma human immunodeficiency virus RNA below 40 Copies/mL is rare in untreated persons even in the first years of infection. J Infect Dis. 1999;180:526–529. - PubMed
    1. Deeks SG, Walker BD. Human immunodeficiency virus controllers: mechanisms of durable virus control in the absence of antiretroviral therapy. Immunity. 2007;27:406–416. - PubMed
    1. Migueles SA, Sabbaghian MS, Shupert WL, Bettinotti MP, Marincola FM, et al. HLA B*5701 is highly associated with restriction of virus replication in a subgroup of HIV-infected long term nonprogressors. Proc Natl Acad Sci U S A. 2000;97:2709–2714. - PMC - PubMed
    1. Frahm N, Kiepiela P, Adams S, Linde CH, Hewitt HS, et al. Control of human immunodeficiency virus replication by cytotoxic T lymphocytes targeting subdominant epitopes. Nat Immunol. 2006;7:173–178. - PubMed

Publication types

MeSH terms