

Heat and drought adaptive QTL in a wheat population designed to minimize confounding agronomic effects
- PMID: 20523964
- PMCID: PMC2938441
- DOI: 10.1007/s00122-010-1351-4
Heat and drought adaptive QTL in a wheat population designed to minimize confounding agronomic effects
Abstract
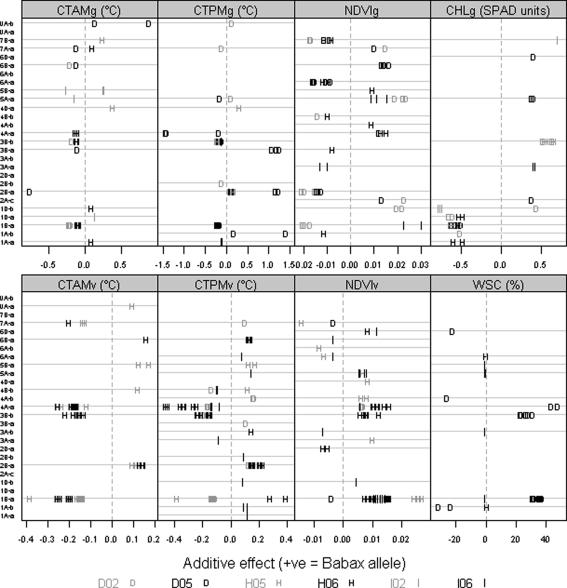
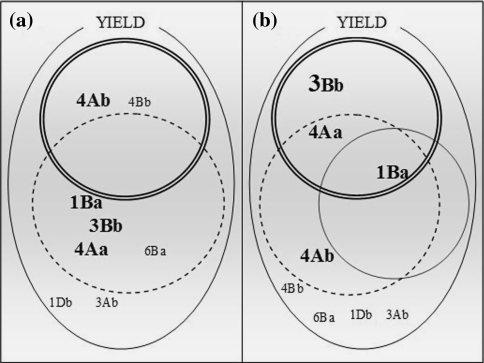
A restricted range in height and phenology of the elite Seri/Babax recombinant inbred line (RIL) population makes it ideal for physiological and genetic studies. Previous research has shown differential expression for yield under water deficit associated with canopy temperature (CT). In the current study, 167 RILs plus parents were phenotyped under drought (DRT), hot irrigated (HOT), and temperate irrigated (IRR) environments to identify the genomic regions associated with stress-adaptive traits. In total, 104 QTL were identified across a combination of 115 traits × 3 environments × 2 years, of which 14, 16, and 10 QTL were associated exclusively with DRT, HOT, and IRR, respectively. Six genomic regions were related to a large number of traits, namely 1B-a, 2B-a, 3B-b, 4A-a, 4A-b, and 5A-a. A yield QTL located on 4A-a explained 27 and 17% of variation under drought and heat stress, respectively. At the same location, a QTL explained 28% of the variation in CT under heat, while 14% of CT variation under drought was explained by a QTL on 3B-b. The T1BL.1RS (rye) translocation donated by the Seri parent was associated with decreased yield in this population. There was no co-location of consistent yield and phenology or height-related QTL, highlighting the utility of using a population with a restricted range in anthesis to facilitate QTL studies. Common QTL for drought and heat stress traits were identified on 1B-a, 2B-a, 3B-b, 4A-a, 4B-b, and 7A-a confirming their generic value across stresses. Yield QTL were shown to be associated with components of other traits, supporting the prospects for dissecting crop performance into its physiological and genetic components in order to facilitate a more strategic approach to breeding.
Figures
References
-
- Araki E, Miura H, Sawada S. Identification of genetic loci affecting amylose content and agronomic traits on chromosome 4A of wheat. Theor Appl Genet. 1999;98:977–984. doi: 10.1007/s001220051158. - DOI
-
- Araus JL, Slafer GA, Royo C, Serret MD. Breeding for yield potential and stress. Adaptation in cereals. Crit Rev Plant Sci. 2008;27:377–412. doi: 10.1080/07352680802467736. - DOI
-
- Breseghello F, Sorrells ME. QTL analysis of kernel size and shape in two hexaploid wheat mapping populations. Field Crops Res. 2007;101:172–179. doi: 10.1016/j.fcr.2006.11.008. - DOI
-
- Cadalen T, Sourdille P, Charmet G, Tixier MH, Gay G, Boeuf C, Bernard S, Leroy P, Bernard M. Molecular markers linked to genes affecting plant height in wheat using a doubled-haploid population. Theor Appl Genet. 1998;96:933–940. doi: 10.1007/s001220050823. - DOI
Publication types
MeSH terms
Substances
LinkOut - more resources
Full Text Sources
Miscellaneous
