

Characterization of the microchemical structure of seed endosperm within a cellular dimension among six barley varieties with distinct degradation kinetics, using ultraspatially resolved synchrotron-based infrared microspectroscopy
- PMID: 20524612
- PMCID: PMC4465227
- DOI: 10.1021/jf101233n
Characterization of the microchemical structure of seed endosperm within a cellular dimension among six barley varieties with distinct degradation kinetics, using ultraspatially resolved synchrotron-based infrared microspectroscopy
Abstract
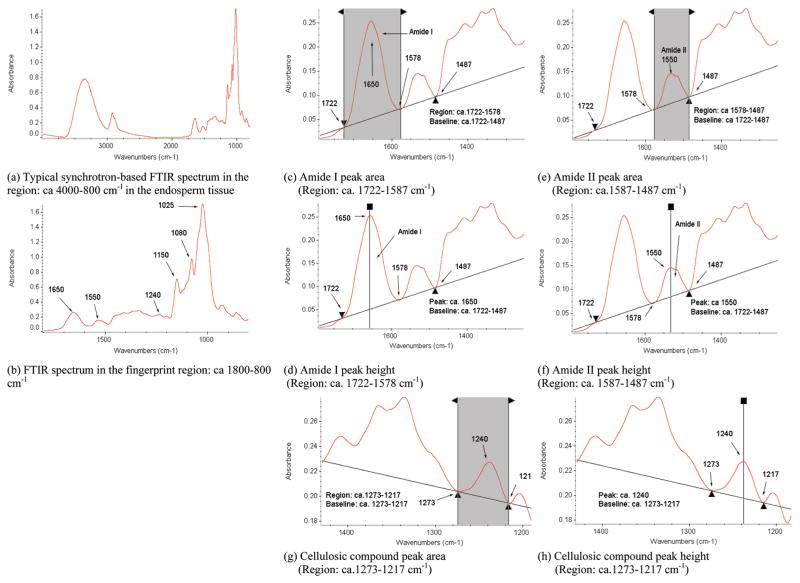
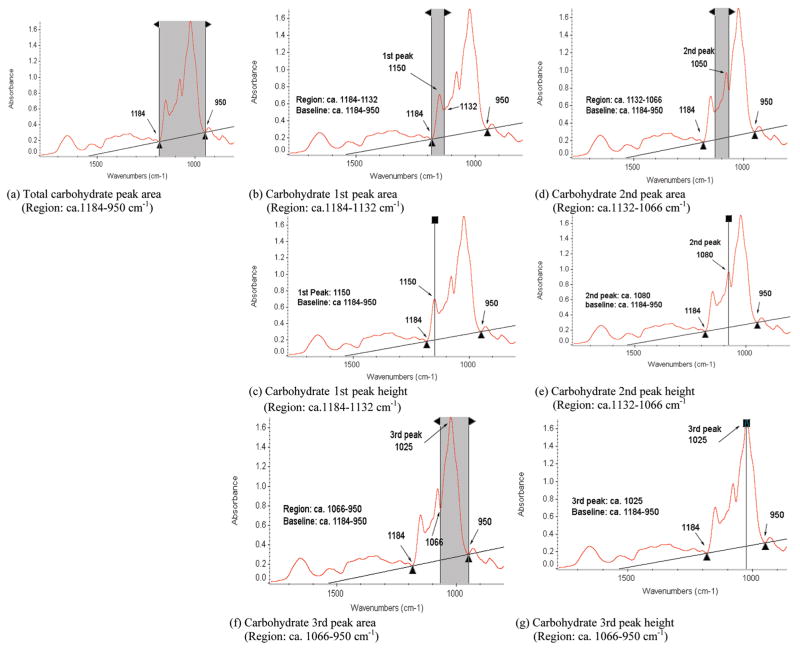
Barley varieties have similar chemical composition but exhibit different rumen degradation kinetics and nutrient availability. These biological differences may be related to molecular, structural, and chemical makeup among the seed endosperm tissue. No detailed study was carried out. The objectives of this study were: (1) to use a molecular spectroscopy technique, synchrotron-based Fourier transform infrared microspectroscopy (SFTIRM), to determine the microchemical-structural features in seed endosperm tissue of six developed barley varieties; (2) to study the relationship among molecular-structural characteristics, degradation kinetics, and nutrient availability in six genotypes of barley. The results showed that inherent microchemical-structural differences in the endosperm among the six barley varieties were detected by the synchrotron-based analytical technique, SFTIRM, with the univariate molecular spectral analysis. The SFTIRM spectral profiles differed (P < 0.05) among the barley samples in terms of the peak ratio and peak area and height intensities of amides I (ca. 1650 cm(-1)) and II (ca. 1550 cm(-1)), cellulosic compounds (ca. 1240 cm(-1)), CHO component peaks (the first peak at the region ca. 1184-1132 cm(-1), the second peak at ca. 1132-1066 cm(-1), and the third peak at ca. 1066-950 cm(-1)). With the SFTIRM technique, the structural characteristics of the cereal seeds were illuminated among different cultivars at an ultraspatial resolution. The structural differences of barley seeds may be one reason for the various digestive behaviors and nutritive values in ruminants. The results show weak correlations between the functional groups' spectral data (peak area, height intensities, and ratios) and rumen biodegradation kinetics (rate and extent of nutrient degradation). Weak correlations may indicate that limited variations of these six barley varieties might not be sufficient to interpret the relationship between spectroscopic information and the nutrient value of barley grain, although significant differences in biodegradation kinetics were observed. In conclusion, the studies demonstrated the potential of ultraspatially resolved synchrotron based technology (SFTIRM) to reveal the structural and chemical makeup within cellular and subcellular dimensions without destruction of the inherent structure of cereal grain tissue.
Figures
References
-
- Hart KJ, Rossnagel BG, Yu P. Chemical characteristics and in situ ruminal parameters of barley for cattle: Comparison of the malting cultivar AC Metcalfe and five feed cultivars. Can J Anim Sci. 2008;88:711–719.
-
- Liu N. MS Thesis. University of Saskatchewan; Saskatoon, Canada: 2009. Ruminal Nutrient Availability and Inherent Structural Features of Six Barley Varieties Using in Situ Technique and Mid-IR Spectroscopy.
-
- Wetzel DL, LeVine SM. Infrared Microbeam Analysis of Intricate Biological Specimens. Institute of Physics; Philadelphia, PA: 2000. pp. 65–66.
-
- Wetzel DL, LeVine SM. Biological Applications of Infrared Microspectroscopy. In: Gremlich H-U, Yan B, editors. Infrared and Raman Spectroscopy of Biological Materials. Marcel Dekker Inc; New York: 2001. pp. 101–142.
-
- Budevska BO. Vibrational Spectroscopy Imaging of Agricultural Products. In: Chalmers JM, Griffiths PR, editors. Handbook of Vibrational Spectroscopy. J. Wiley; Hoboken, NJ: 2002. pp. 3720–3732.
Publication types
MeSH terms
Grants and funding
LinkOut - more resources
Full Text Sources
