

Differences in aortic arch geometry, hemodynamics, and plaque patterns between C57BL/6 and 129/SvEv mice
- PMID: 20524728
- PMCID: PMC3047446
- DOI: 10.1115/1.4000168
Differences in aortic arch geometry, hemodynamics, and plaque patterns between C57BL/6 and 129/SvEv mice
Abstract
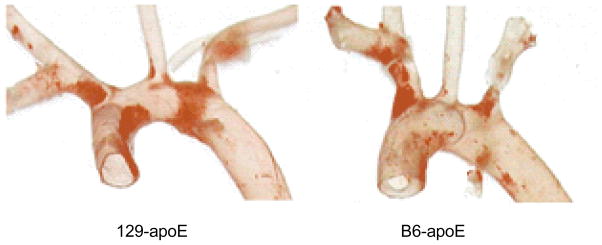
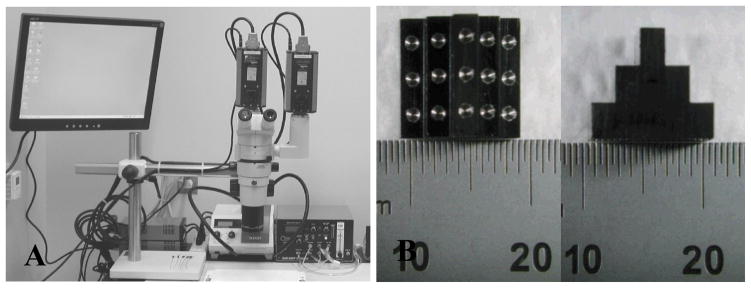
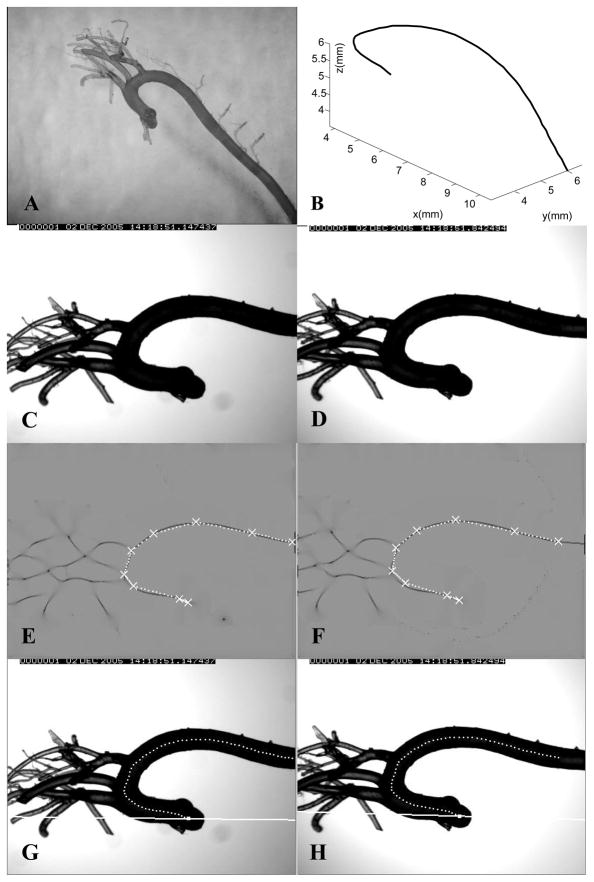
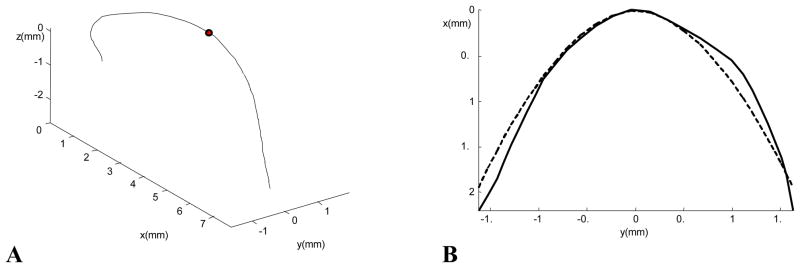
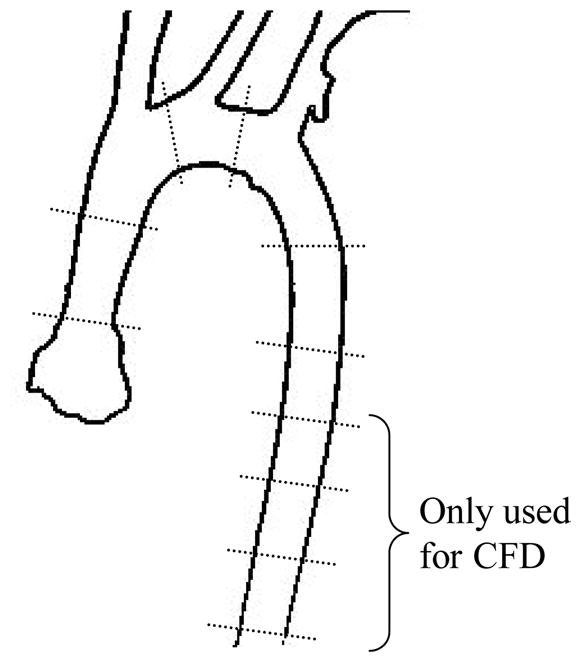
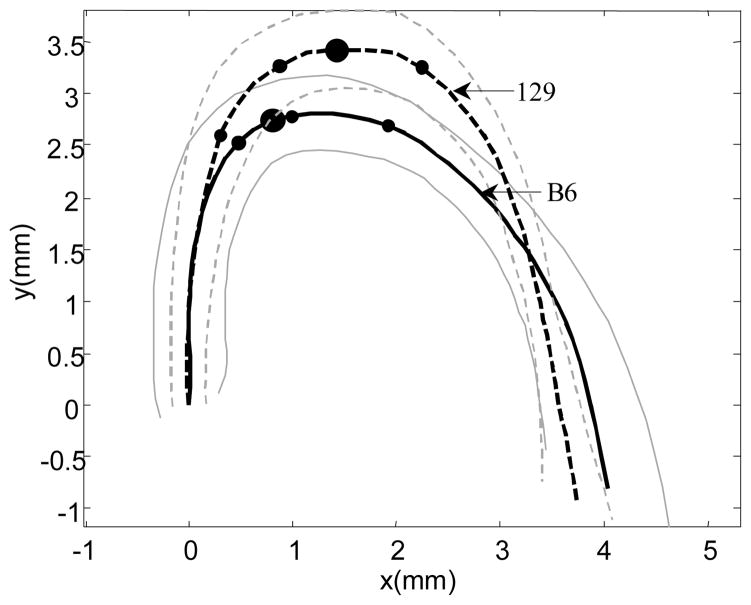
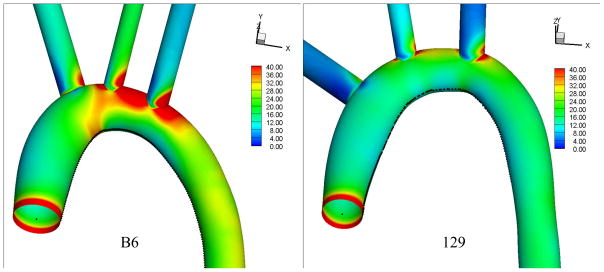
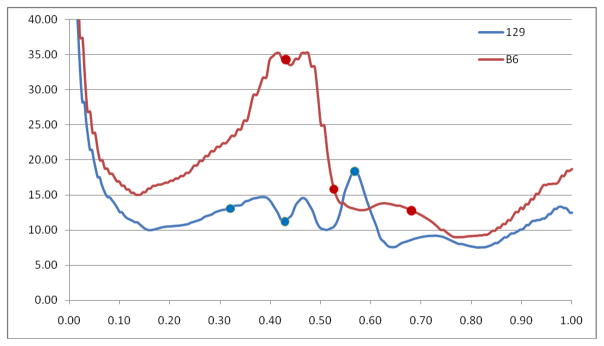
Atherosclerotic plaques are distributed differently in the aortic arches of C57BL/6 (B6) and 129/SvEv (129) apolipoprotein E (apoE)-deficient mice. It is now recognized that hemodynamic wall shear stress (WSS) plays an important role in the localization of atherosclerotic development. Since the blood flow field in the vessel is modulated by the vascular geometry, we quantitatively examined the difference in the aortic arch geometry and hemodynamic WSS between the two corresponding wild-type mouse strains. The three-dimensional (3D) geometry of 14 murine aortic arches, seven from each strain, was characterized using casts and stereo microscopic imaging. Based on the geometry of each cast, an average 3D geometry of the aortic arch for each mouse strain was obtained, and computational fluid dynamic calculations were performed in the two average aortic arches. Many geometric features, including aortic arch shape, vessel diameter, and branch locations, were significantly different at p<0.05 between the two mouse strains. Lower shear stress was found at the inner curvature of the aortic arch in the 129 strain, corresponding to greater involvement in the corresponding apoE-deficient mice relative to the B6 strain. These results support the notion that heritable features of arterial geometry can contribute to individual differences in local susceptibility to arterial disease.
Figures
References
-
- Preventing chronic diseases: a vital investment. Geneva: World Health Organization; 2005. p. 182.
-
- Breslow JL. Mouse Models of Atherosclerosis. Science. 1996;272:685–688. - PubMed
-
- Brinkman AM, Baker PB, Newman WP, Vigorito R, Friedman MH. Variability of human coronary-artery geometry - an angiographic study of the left anterior descending arteries of 30 autopsy hearts. Ann Biomed Eng. 1994;22:34–44. - PubMed
-
- Cook MJ. The anatomy of the laboratory mouse. New York: Academic Press; 1965. p. 143.
-
- Daugherty A. Mouse models of atherosclerosis. Am J Med Sci. 2002;323:3–10. - PubMed
Publication types
MeSH terms
Grants and funding
LinkOut - more resources
Full Text Sources
Medical
Research Materials
Miscellaneous
