

Electrophysiological evidence of mediolateral functional dichotomy in the rat nucleus accumbens during cocaine self-administration II: phasic firing patterns
- PMID: 20525080
- PMCID: PMC3004470
- DOI: 10.1111/j.1460-9568.2010.07230.x
Electrophysiological evidence of mediolateral functional dichotomy in the rat nucleus accumbens during cocaine self-administration II: phasic firing patterns
Abstract
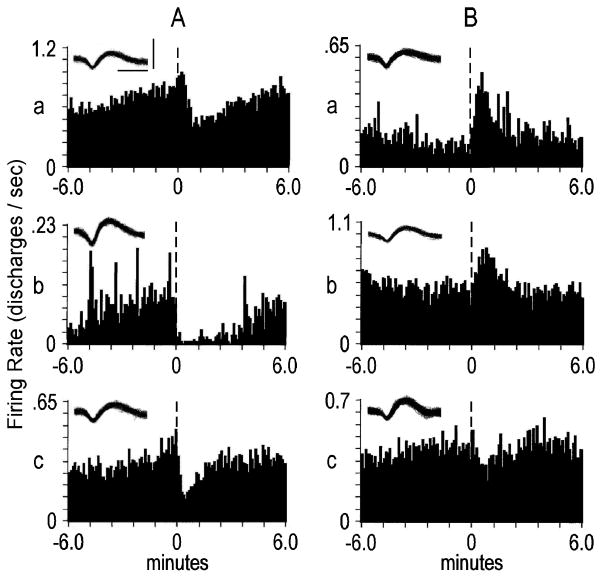
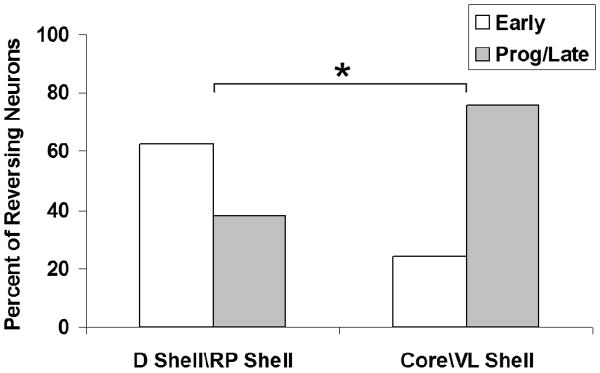
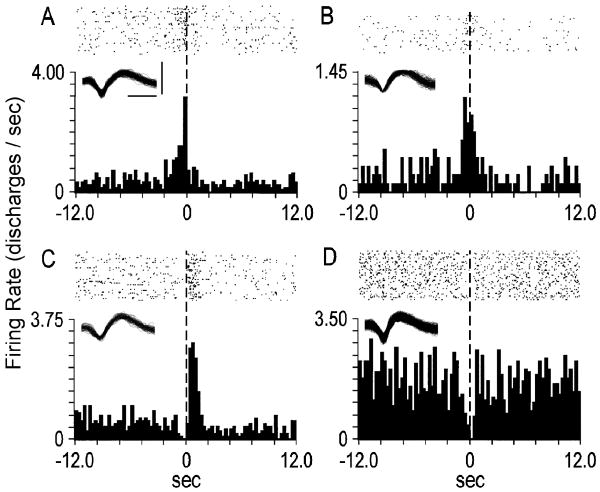
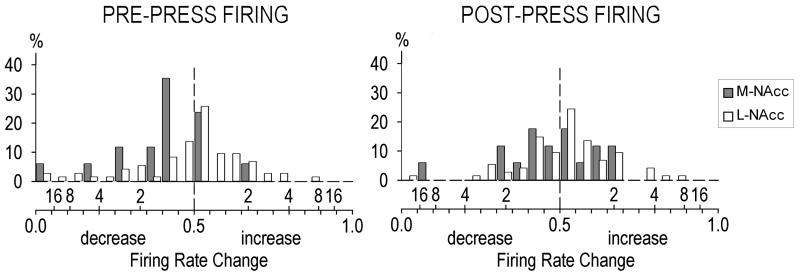
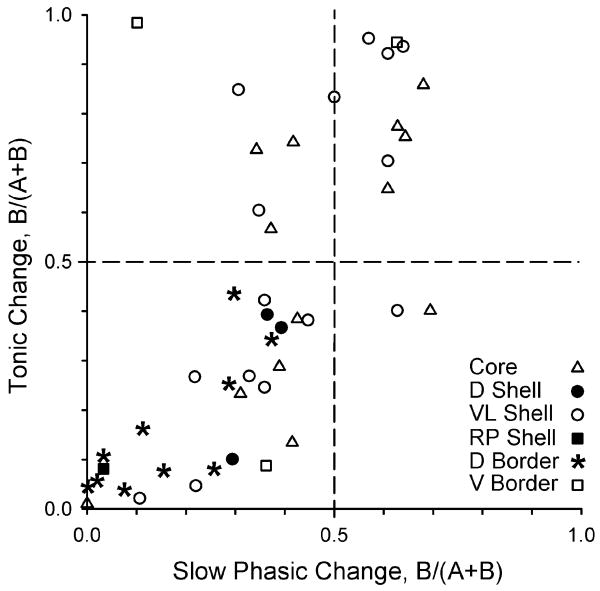
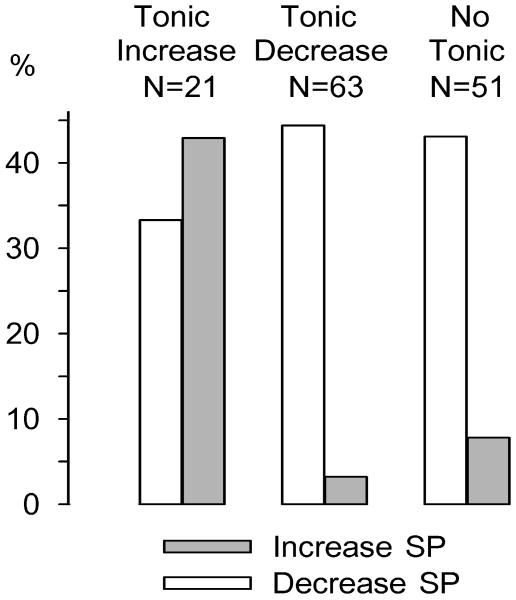
In the cocaine self-administering rat, individual nucleus accumbens (NAcc) neurons exhibit phasic changes in firing rate within minutes and/or seconds of lever presses (i.e. slow phasic and rapid phasic changes, respectively). To determine whether neurons that demonstrate these changes during self-administration sessions are differentially distributed in the NAcc, rats were implanted with jugular catheters and microwire arrays in different NAcc subregions (core, dorsal shell, ventromedial shell, ventrolateral shell, or rostral pole). Neural recording sessions were typically conducted on days 13-17 of cocaine self-administration (0.77 mg/kg per 0.2-mL infusion; fixed-ratio 1 schedule of reinforcement; 6-h daily sessions). Pre-press rapid phasic firing rate changes were greater in lateral accumbal (core and ventrolateral shell) than in medial accumbal (dorsal shell and rostral pole shell) subregions. Slow phasic pattern analysis revealed that reversal latencies of neurons that exhibited change + reversal patterns differed mediolaterally: medial NAcc neurons exhibited more early reversals and fewer progressive/late reversals than lateral NAcc neurons. Comparisons of firing patterns within individual neurons across time bases indicated that lateral NAcc pre-press rapid phasic increases were correlated with tonic increases. Tonic decreases were correlated with slow phasic patterns in individual medial NAcc neurons, indicative of greater pharmacological sensitivity of neurons in this region. On the other hand, the bias of the lateral NAcc towards increased pre-press rapid phasic activity, coupled with a greater prevalence of tonic increase firing, may reflect particular sensitivity of these neurons to excitatory afferent signaling and perhaps differential pharmacological influences on firing rates between regions.
Figures
Similar articles
-
Electrophysiological evidence of mediolateral functional dichotomy in the rat accumbens during cocaine self-administration: tonic firing patterns.Eur J Neurosci. 2009 Dec;30(12):2387-400. doi: 10.1111/j.1460-9568.2009.07033.x. Epub 2009 Dec 10. Eur J Neurosci. 2009. PMID: 20092580 Free PMC article.
-
Higher magnitude accumbal phasic firing changes among core neurons exhibiting tonic firing increases during cocaine self-administration.Neuroscience. 2006 Feb;137(3):1075-85. doi: 10.1016/j.neuroscience.2005.10.026. Epub 2005 Dec 1. Neuroscience. 2006. PMID: 16325346
-
Slow phasic and tonic activity of ventral pallidal neurons during cocaine self-administration.Synapse. 2012 Feb;66(2):106-27. doi: 10.1002/syn.20990. Epub 2011 Nov 3. Synapse. 2012. PMID: 21953543 Free PMC article.
-
Nucleus accumbens cell firing during goal-directed behaviors for cocaine vs. 'natural' reinforcement.Physiol Behav. 2002 Jul;76(3):379-87. doi: 10.1016/s0031-9384(02)00760-6. Physiol Behav. 2002. PMID: 12117574 Review.
-
The Critical Role of Peripheral Targets in Triggering Rapid Neural Effects of Intravenous Cocaine.Neuroscience. 2020 Dec 15;451:240-254. doi: 10.1016/j.neuroscience.2020.09.050. Epub 2020 Oct 1. Neuroscience. 2020. PMID: 33010343 Free PMC article. Review.
Cited by
-
Nucleus accumbens shell neurons' early sensitivity to cocaine is associated with future increases in drug intake.Addict Neurosci. 2023 Dec;8:100107. doi: 10.1016/j.addicn.2023.100107. Epub 2023 Jun 14. Addict Neurosci. 2023. PMID: 37664219 Free PMC article.
-
Olfactory tubercle neurons exhibit slow-phasic firing patterns during cocaine self-administration.Synapse. 2014 Jul;68(7):321-3. doi: 10.1002/syn.21744. Epub 2014 Apr 15. Synapse. 2014. PMID: 24700541 Free PMC article. No abstract available.
-
Differential roles of ventral pallidum subregions during cocaine self-administration behaviors.J Comp Neurol. 2013 Feb 15;521(3):558-88. doi: 10.1002/cne.23191. J Comp Neurol. 2013. PMID: 22806483 Free PMC article.
-
The ventromedial ventral pallidum subregion is necessary for outcome-specific Pavlovian-instrumental transfer.J Neurosci. 2013 Nov 27;33(48):18707-9. doi: 10.1523/JNEUROSCI.4021-13.2013. J Neurosci. 2013. PMID: 24285876 Free PMC article. No abstract available.
-
Untangling dopamine and glutamate in the ventral tegmental area.bioRxiv [Preprint]. 2025 Feb 26:2025.02.25.640201. doi: 10.1101/2025.02.25.640201. bioRxiv. 2025. PMID: 40060543 Free PMC article. Preprint.
References
-
- Arbuthnott GW, Wickens J. Space, time and dopamine. Trends Neurosci. 2007;30(2):62–69. - PubMed
-
- Barrot M, Marinelli M, Abrous DN, Rougé-Pont F, Le Moal M, Piazza PV. Functional heterogeneity in dopamine release and in the expression of Fos-like proteins within the rat striatal complex. Eur J Neurosci. 1999;11:1155–1166. - PubMed
-
- Carelli RM, King VC, Hampson RE, Deadwyler SA. Firing patterns of nucleus accumbens neurons during cocaine self-administration in rats. Brain Res. 1993;626:14–22. - PubMed
Publication types
MeSH terms
Substances
Grants and funding
LinkOut - more resources
Full Text Sources
Medical
