. 2010 May;216(5):611-24.
doi: 10.1111/j.1469-7580.2010.01223.x.

VEGF and its role in the early development of the long bone epiphysis

Affiliations

VEGF and its role in the early development of the long bone epiphysis

Doris Allerstorfer et al. J Anat. 2010 May.

Abstract

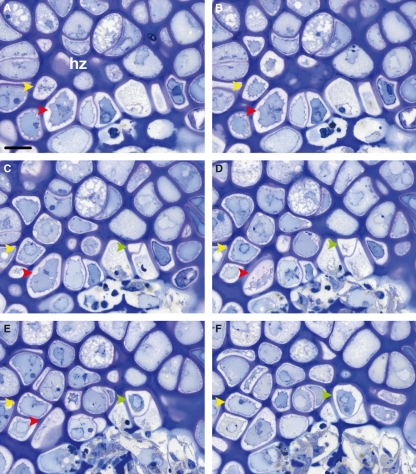
In long bones of murine species, undisturbed development of the epiphysis depends on the generation of vascularized cartilage canals shortly after birth. Despite its importance, it is still under discussion how this event is exactly regulated. It was suggested previously that, following increased hypoxia in the epiphyseal core, angiogenic factors are expressed and hence stimulate the ingrowth of the vascularized canals. In the present study, we tested this model and examined the spatio-temporal distribution of two angiogenic molecules during early development in mice. In addition, we investigated the onset of cartilage hypertrophy and mineralization. Our results provide evidence that the vascular endothelial growth factor is expressed in the epiphyseal resting cartilage prior to the moment of canal formation and is continuously expressed until the establishment of a large secondary ossification centre. Interestingly, we found no expression of secretoneurin before the establishment of the canals although this factor attracts blood vessels under hypoxic conditions. Epiphyseal development further involves maturation of the resting chondrocytes into hypertrophic ones, associated with the mineralization of the cartilage matrix and eventual death of the latter cells. Our results suggest that vascular endothelial growth factor is the critical molecule for the generation of the epiphyseal vascular network in mice long bones. Secretoneurin, however, does not appear to be a player in this event. Hypertrophic chondrocytes undergo cell death by a mechanism interpreted as chondroptosis.


Figures

Fig. 3
Fig. 3
LM micrographs. (A–F) Consecutive semithin cross-sections (2 μm, stained with toluidine blue) through the hypertrophic zone (hz) where numerous chondrocytes in different developmental stages are depicted. A photographic sequence of six successive sections that have the same magnification as well as orientation is shown. Some hypertrophic cells are detached from the lacunar wall and have already begun cell death, but others appear to be intact and fill their lacuna. Arrowheads in different colours point to the course of several chondrocytes. (C) The green arrowhead indicates an empty lacuna, but the following sections clearly show that it is occupied by shrunken cell, which presumably is assigned to die; scale bar = 20 μm.
Fig. 2
Fig. 2
TEM micrographs of mice aged 6 (A) and 7 days (B–F), respectively, show the transformation process from a resting (A) to a dying hypertrophic chondrocyte (F). (A) A typical resting chondrocyte (rCh) within its lacuna is shown. The cell is spherical in shape, contains a large amount of rough endoplasmic reticulum (rer) and has an equally roundish nucleus (n); scale bar = 5 μm. (B,C) During the transformation process the cytoplasm of the resting chondrocytes is altered, leading to a large homogeneous area (asterisks) and a less prominent rer as compared with (A). Mitochondria (m) and a distinct Golgi apparatus (g) are still noticeable; scale bars = 5 and 1 μm. (D,E) Hypertrophic chondrocytes (hCh) appear for the first time 7–8 days after birth, with an electron-translucent cytoplasm and numerous lysosomes (ly). They also contain several mitochondria (m) and fragments of rough endoplasmic reticulum (rer). The cells are surrounded by a mineralized cartilage matrix indicated by the asterisks; scale bars = 5 and 1 μm. (F) Dying hypertrophic chondrocytes appear shrunken and are detached from the lacunar wall. In addition, their cell fragments are sequestered into the lacunar cavity; scale bar = 5 μm.
Fig. 1
Fig. 1
LM micrographs. (A–D) (von Kossa reaction on paraffin sections): Latero-medial sections through the distal part of the femur at different developmental stages (D 6, 7, and 9). Von Kossa reaction indicates the mineralized extracellular matrix (black staining). (A) At D 6 the epiphysis comprises solely resting cartilage (rz), and mineralized extracellular matrix is only visible within the primary ossification centre (poc). Inset (semithin section stained with toluidine blue) shows the roundish chondrocytes of the resting zone (rz); scale bar in the inset = 20 μm. (B) Within the epiphysis, mineralized cartilage is seen for the first time in mice aged 7 days. It is associated with the hypertrophy of the chondrocytes. (C–D) At D 9 the mineralized area has increased. (D) A cartilage canal (cc) with its ramified segment in the calcified hypertrophic zone (hz) is depicted. The extracellular matrix of the resting zone (rz) remains uncalcified; scale bar = 50 μm. (A–C) Same magnification; scale bar = 500 μm. (E,F) Semithin resin cross-section (2 μm) through the epiphysis stained with toluidine blue. (E) By D 7 cartilage canals (cc) are highly branched within the hypertrophic zone (hz), but the segment with the resting zone remains non-ramified; scale bar = 50 μm. Inset (higher magnification) shows that the canal vessels (red arrowheads) are solely composed of endothelium cells; scale bar = 20 μm. (F) No zone of flattened chondrocytes is encountered between the resting (rz) and the hypertrophic zone (hz); scale bar = 20 μm. (G–I) (Frontal paraffin sections through the distal part of the femur of mice aged 18 and 20 days, respectively. The sections are stained with Masson’s trichrome). (G) A large secondary ossification centre (soc) is seen within the epiphysis. The metaphyseal growth plate (gp) is located between the SOC (soc) and POC (poc); scale bar 500 μm. (H) The adjacent zone of the SOC distal border is formed by hypertrophic chondrocytes (hz), whereas the articular cartilage comprises resting chondrocytes (rz). (I) Proximally, the SOC is surrounded by resting chondrocytes (rz) followed by the proliferative zone (pz) of the metaphyseal growth plate. (H,I) Same magnification; scale bar = 50 μm.
Fig. 4
Fig. 4
IHC and HC: Caspase 3 (brown staining) and TRAP (red staining). (A–C) Latero-medial sections counterstained with haematoxylin through the distal femoral epiphysis. (A,B) In mice aged 7, 8, and 9 days, several caspase 3-positive chondrocytes are noted around the ramified endings of the cartilage canals (cc) within the hypertrophic zone (hz). Additionally, multinucleated TRAP-positive cells are present in the canal lumen; scale bars = 20 μm. (C) The epiphysis of a 20-day-old mouse is depicted. At the distal margin of the SOC (soc) numerous hypertrophic chondrocytes (hz) stained positively, whereas on the proximal chondro-osseous junction only a few resting chondrocytes (rz) are labelled. This staining pattern was also encountered in the 18-day-old mouse; scale bar = 100 μm. (D,E) Longitudinal section through the proliferative (pz) and hypertrophic zone (hz) of the metaphyseal growth plate of a 18-day-old mouse. Only the hypertrophic chondrocytes are immunoreactive for caspase 3. Numerous multinucleated chondroclasts (chc) and vessels (v) are found at the chondro-osseous junction of the POC. These labelling patterns were identical for all stages investigated (D 7–20). (E) A higher magnification of D; scale bars = 20 μm.
Fig. 6
Fig. 6
IHC and HC: VEGF (brown staining) and TRAP (red staining). (A–D) Latero-medial sections through the distal femoral epiphysis of mice aged 18 and 20 days, respectively. (A) The SOC (soc), the proliferative (pz) and the hypertrophic zones (hz) of the metaphyseal growth plate are shown. Staining for VEGF is noted around the SOC and within the hypertrophic chondrocytes of the metaphyseal growth plate; scale bar = 100 μm. The following panels (B–D) reveal this staining pattern in detail. (B) Hypertrophic chondrocytes on the distal chondro-osseous junction of the SOC are VEGF-positive. Inset demonstrates a higher magnification of the labelled cells. Within the SOC, several TRAP-positive chondroclasts (chc) are attached to the mineralized cartilage; scale bars = 20 μm. (C,D) Consecutive sections (same magnification) are depicted. A signal for VEGF is discernible in the resting chondrocytes (rz) at the proximal border of the SOC but many of these cells reveal only a weak labelling. This is more obvious when sections are not counterstained with haematoxylin (D). In addition, VEGF is noticeable in the hypertrophic chondrocytes (hz) of the metaphyseal growth plate, whereas the proliferating chondrocytes (pz) are negative for the growth factor; scale bar = 50 μm. (E) The chondro-osseous junction of the primary ossification centre from a mouse aged 9 days is shown. Hypertrophic chondrocytes and numerous osteoblasts (black arrowheads and labelled as ob in the inset) are VEGF-positive. Multinucleated TRAP-positive chondroclasts (chc) are seen at the junction. These staining patterns are identical throughout development (D 4–20); scale bars = 20 μm. (F) A human kidney was used as a positive control, and VEGF is discernible in the cells of a glomerulus; scale bar = 20 μm.
Fig. 5
Fig. 5
IHC and HC: VEGF (brown staining) and TRAP (red staining). The micrographs exhibit longitudinal sections through the femoral epiphysis and demonstrate the spatio-temporal distribution of both VEGF and TRAP during advancing development. (A–C) (D 4). (A) VEGF is identified within the perichondrium (p) and in certain areas of the resting zone (rz) directly below it. The green arrowheads delineate an accumulation of the VEGF-positive resting chondrocytes. The section is not counterstained with haematoxylin; scale bar = 50 μm. Inset: the section is counterstained, and the yellow arrowhead points to a TRAP cell within the perichondrium; scale bar = 20 μm. (B) A higher magnification of the area depicted by the green arrowheads (panel A) is shown. The cells of the perichondrium (p) as well as the resting chondrocytes below it display a strong immunoreactivity for VEGF. (C) The resting chondrocytes in the centre of the epiphysis exhibit only a weak staining for the growth factor. (B,C) Same magnification; scale bar = 20 μm. (D,E) Consecutive sections (same magnification) through the apical tip of a cartilage canal at D 5. Within the canal lumen few VEGF- (black arrows) and TRAP-positive cells are seen. Furthermore, several resting chondrocytes ahead of the canal tip are immunostained with the growth factor (green arrowheads); scale bar = 20 μm. (F–H) Mice aged 6 days have the same staining pattern as described before. (F) An overview of the epiphysis with its growth plate is shown. VEGF is detected in the hypertrophic zone (hz) and in several resting chondrocytes around a cartilage canal (black arrowhead). Proliferating chondrocytes show no brown reaction product; scale bar = 100 μm. (G) A higher magnification of F. Several VEGF-positive resting chondrocytes are detectable in front of two cartilage canals (cc) that originate from the perichondrium (p); scale bar = 50 μm. (H) Section (counterstained) through the tip of a canal. The canal cells show a strong staining for VEGF. In addition, a TRAP-positive cell is seen. Green arrowhead denotes a VEGF-positive chondrocyte of the resting zone (rz); scale bar = 20 μm. (I,J) During progressing development (D 7 and 9) VEGF is encountered in the cells of the canals (cc) and the perichondrium (p). In addition, immunoreactivity is seen in the chondrocytes of the resting (rz) and hypertrophic zones (hz). The section in J is not counterstained; scale bar = 20 μm (I), and 50 μm (J).
Fig. 7
Fig. 7
IHC and HC: SN (brown staining) and TRAP (red staining). (A,B) Frontal sections through the distal femoral epiphysis of mice aged 4 and 20 days, respectively. The sections are not counterstained. (A) An overview, demonstrating the resting (rz), proliferative (pz) and hypertrophic zone and the chondro-osseous junction of the POC (poc) is shown. No staining is found within the chondrocytes but numerous skeletal muscle fibres (m) are SN-positive; scale bar = 100 μm. (B) At D 20, a large SOC (soc) is seen within the epiphysis. The metaphyseal growth plate (gp) is located between the POC (poc) and the SOC (soc). Note that the staining for SN has decreased and fewer muscle fibres (m) are labelled; scale bar = 500 μm.
Fig. 8
Fig. 8
ISH: VEGF mRNA (blue staining) (A–E) Latero-medial sections through the distal femoral epiphysis at D 4 and 6 display the spatio-temporal localization of the VEGF mRNA. The sections are not counterstained. (A,B) In the 4-day-old mouse, VEGF is expressed in the perichondrium (p) and resting chondrocytes (rz) beneath it. Resting chondrocytes in the centre of the epiphysis show only a faint labelling. (C) Specificity of the labelling is demonstrated by comparing normally incubated sections with sections additionally hybridized with 1000-fold excess of non-FAM-labelled probes. These sections show no staining. (A–C) Same magnification; scale bar = 20 μm. (D,E) Consecutive sections through the tip of a cartilage canal (cc) of a 6-day-old mouse. VEGF expression is displayed in some perivascular canal cells and in the chondrocytes of the resting zone (rz). (D,E) Same magnification; scale bar = 20 μm. (F–I) Distribution of VEGF mRNA in a 20-day-old mouse. (F) Frontal section through the distal femoral epiphysis depicting the SOC (soc), the hypertrophic zone (hz) at its distal border and the resting zone (rz) at its proximal border. In addition, the proliferative zone (pz) of the metaphyseal growth plate is displayed; scale bar = 100 μm. The following micrographs demonstrate in detail the localization of the VEGF expression. (G) VEGF mRNA is encountered in the hypertrophic chondrocytes at the distal chondro-osseous margin of the SOC; scale bar = 20 μm. (H,I) On the proximal junction, VEGF mRNA in resting chondrocytes is mainly restricted to the outer edge (I), whereas in the innermost area (H) only a few chondrocytes (rz) are labelled. (H,I) Same magnification; scale bar = 20 μm. (J) The chondro-osseous junction of the POC (poc) is demonstrated. VEGF expression is discernible in the hypertrophic chondrocytes (hz) and in several osteoblasts (inset, black arrowheads); scale bar = 20 μm.

Similar articles

Cited by

References

    1. Álvarez J, Costales L, Serra R, et al. Expression patterns of matrix metalloproteinases and vascular endothelial growth factor during epiphyseal ossification. J Bone Miner Res. 2005a;20:1011–1021. - PubMed
    1. Álvarez J, Costales L, López-Muñiz A, et al. Chondrocytes are released as viable cells during cartilage resorption associated with the formation of intrachondral canals in the rat tibial epiphysis. Cell Tissue Res. 2005b;320:501–507. - PubMed
    1. Aszódi A, Bateman JF, Gustafsson E, et al. Mammalian skeletogenesis and extracellular matrix: what can we learn from knockout mice. Cell Struct Funct. 2000;25:73–84. - PubMed
    1. Blumer MJF, Gahleitner P, Narzt T, et al. Ribbons of semithin sections: an advanced method with a new type of diamond knife. J Neurosci Methods. 2002;120:11–16. - PubMed
    1. Blumer MJF, Longato S, Schwarzer C, et al. Bone development in the femoral epiphysis of mice: the role of cartilage canals and the fate of resting chondrocytes. Dev Dyn. 2007;236:2077–2088. - PubMed

Publication types

Substances

LinkOut - more resources