

AlignMiner: a Web-based tool for detection of divergent regions in multiple sequence alignments of conserved sequences
- PMID: 20525162
- PMCID: PMC2902484
- DOI: 10.1186/1748-7188-5-24
AlignMiner: a Web-based tool for detection of divergent regions in multiple sequence alignments of conserved sequences
Abstract
Background: Multiple sequence alignments are used to study gene or protein function, phylogenetic relations, genome evolution hypotheses and even gene polymorphisms. Virtually without exception, all available tools focus on conserved segments or residues. Small divergent regions, however, are biologically important for specific quantitative polymerase chain reaction, genotyping, molecular markers and preparation of specific antibodies, and yet have received little attention. As a consequence, they must be selected empirically by the researcher. AlignMiner has been developed to fill this gap in bioinformatic analyses.
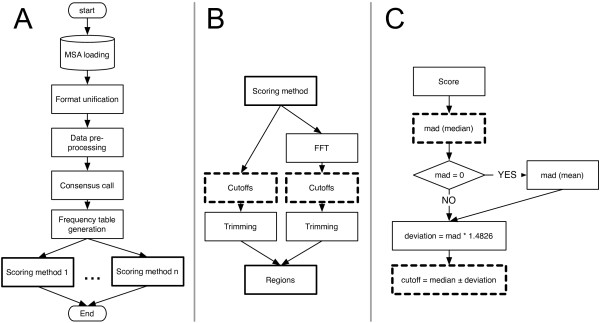
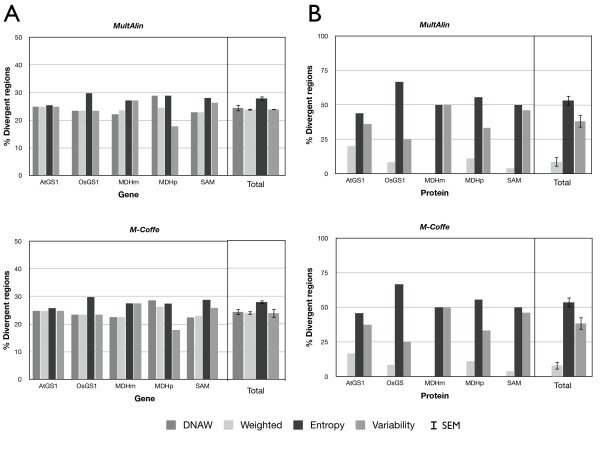
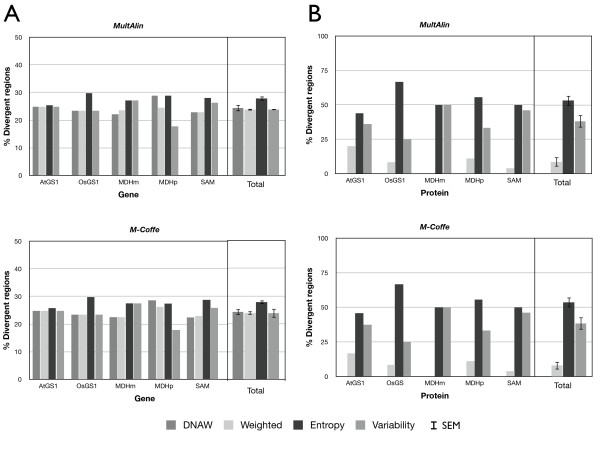
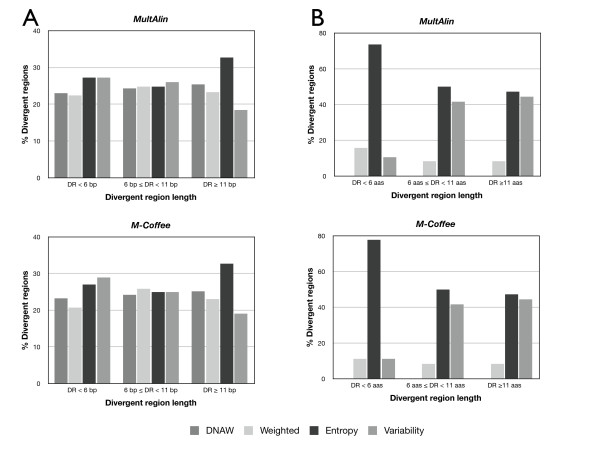
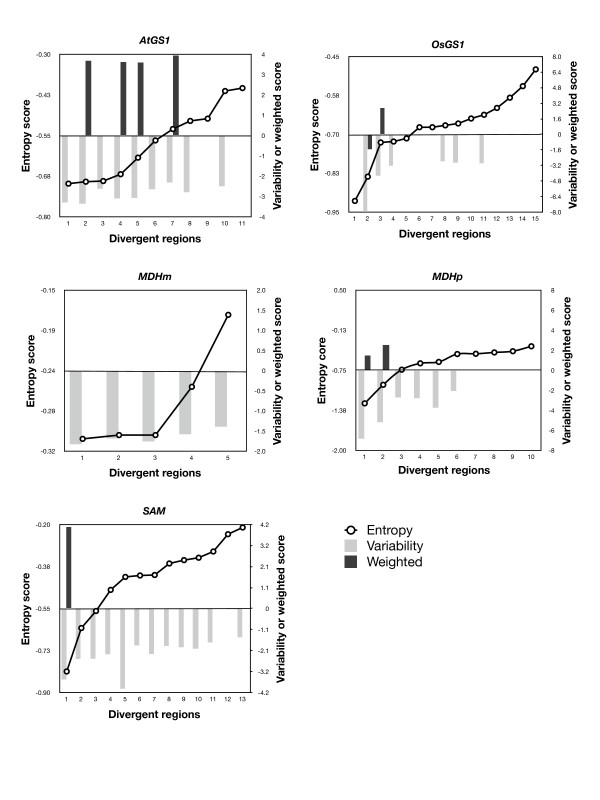
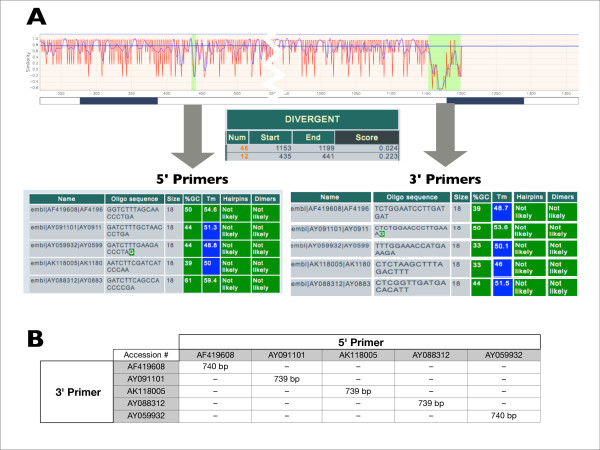
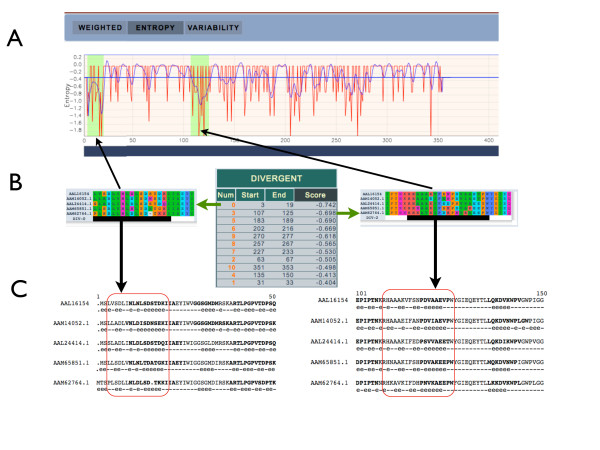
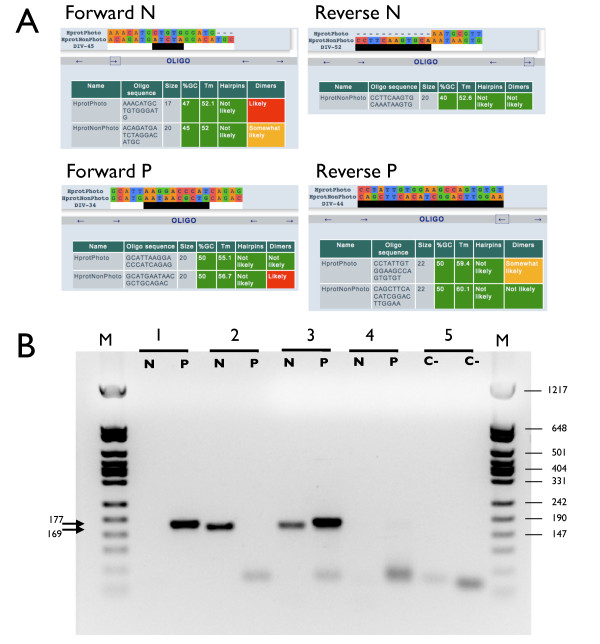
Results: AlignMiner is a Web-based application for detection of conserved and divergent regions in alignments of conserved sequences, focusing particularly on divergence. It accepts alignments (protein or nucleic acid) obtained using any of a variety of algorithms, which does not appear to have a significant impact on the final results. AlignMiner uses different scoring methods for assessing conserved/divergent regions, Entropy being the method that provides the highest number of regions with the greatest length, and Weighted being the most restrictive. Conserved/divergent regions can be generated either with respect to the consensus sequence or to one master sequence. The resulting data are presented in a graphical interface developed in AJAX, which provides remarkable user interaction capabilities. Users do not need to wait until execution is complete and can.even inspect their results on a different computer. Data can be downloaded onto a user disk, in standard formats. In silico and experimental proof-of-concept cases have shown that AlignMiner can be successfully used to designing specific polymerase chain reaction primers as well as potential epitopes for antibodies. Primer design is assisted by a module that deploys several oligonucleotide parameters for designing primers "on the fly".
Conclusions: AlignMiner can be used to reliably detect divergent regions via several scoring methods that provide different levels of selectivity. Its predictions have been verified by experimental means. Hence, it is expected that its usage will save researchers' time and ensure an objective selection of the best-possible divergent region when closely related sequences are analysed. AlignMiner is freely available at http://www.scbi.uma.es/alignminer.
Figures
Similar articles
-
Using CLUSTAL for multiple sequence alignments.Methods Enzymol. 1996;266:383-402. doi: 10.1016/s0076-6879(96)66024-8. Methods Enzymol. 1996. PMID: 8743695
-
RExPrimer: an integrated primer designing tool increases PCR effectiveness by avoiding 3' SNP-in-primer and mis-priming from structural variation.BMC Genomics. 2009 Dec 3;10 Suppl 3(Suppl 3):S4. doi: 10.1186/1471-2164-10-S3-S4. BMC Genomics. 2009. PMID: 19958502 Free PMC article.
-
BatchPrimer3: a high throughput web application for PCR and sequencing primer design.BMC Bioinformatics. 2008 May 29;9:253. doi: 10.1186/1471-2105-9-253. BMC Bioinformatics. 2008. PMID: 18510760 Free PMC article.
-
Genome-scale probe and primer design with PRIMEGENS.Methods Mol Biol. 2007;402:159-76. doi: 10.1007/978-1-59745-528-2_8. Methods Mol Biol. 2007. PMID: 17951795 Review.
-
A guide to bioinformatics for immunologists.Front Immunol. 2013 Dec 4;4:416. doi: 10.3389/fimmu.2013.00416. Front Immunol. 2013. PMID: 24363654 Free PMC article. Review.
Cited by
-
Rational Design of Profile HMMs for Sensitive and Specific Sequence Detection with Case Studies Applied to Viruses, Bacteriophages, and Casposons.Viruses. 2023 Feb 13;15(2):519. doi: 10.3390/v15020519. Viruses. 2023. PMID: 36851733 Free PMC article.
-
EuroPineDB: a high-coverage web database for maritime pine transcriptome.BMC Genomics. 2011 Jul 15;12:366. doi: 10.1186/1471-2164-12-366. BMC Genomics. 2011. PMID: 21762488 Free PMC article.
-
ReprOlive: a database with linked data for the olive tree (Olea europaea L.) reproductive transcriptome.Front Plant Sci. 2015 Aug 11;6:625. doi: 10.3389/fpls.2015.00625. eCollection 2015. Front Plant Sci. 2015. PMID: 26322066 Free PMC article.
References
LinkOut - more resources
Full Text Sources
Other Literature Sources
Research Materials
Miscellaneous
