

A decision support framework for the discrimination of children with controlled epilepsy based on EEG analysis
- PMID: 20525164
- PMCID: PMC2890629
- DOI: 10.1186/1743-0003-7-24
A decision support framework for the discrimination of children with controlled epilepsy based on EEG analysis
Abstract
Background: In this work we consider hidden signs (biomarkers) in ongoing EEG activity expressing epileptic tendency, for otherwise normal brain operation. More specifically, this study considers children with controlled epilepsy where only a few seizures without complications were noted before starting medication and who showed no clinical or electrophysiological signs of brain dysfunction. We compare EEG recordings from controlled epileptic children with age-matched control children under two different operations, an eyes closed rest condition and a mathematical task. The aim of this study is to develop reliable techniques for the extraction of biomarkers from EEG that indicate the presence of minor neurophysiological signs in cases where no clinical or significant EEG abnormalities are observed.
Methods: We compare two different approaches for localizing activity differences and retrieving relevant information for classifying the two groups. The first approach focuses on power spectrum analysis whereas the second approach analyzes the functional coupling of cortical assemblies using linear synchronization techniques.
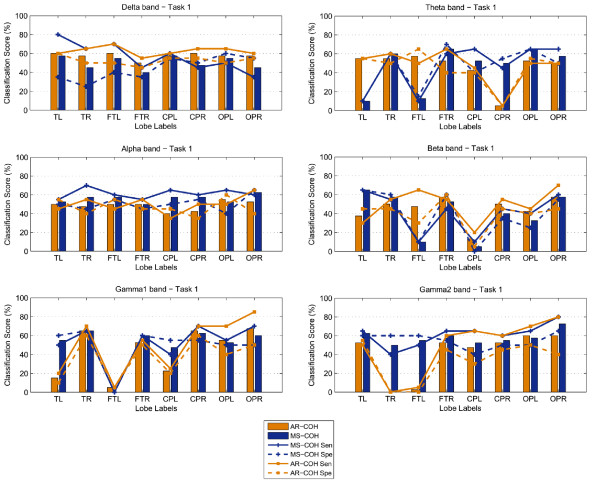
Results: Differences could be detected during the control (rest) task, but not on the more demanding mathematical task. The spectral markers provide better diagnostic ability than their synchronization counterparts, even though a combination (or fusion) of both is needed for efficient classification of subjects.
Conclusions: Based on these differences, the study proposes concrete biomarkers that can be used in a decision support system for clinical validation. Fusion of selected biomarkers in the Theta and Alpha bands resulted in an increase of the classification score up to 80% during the rest condition. No significant discrimination was achieved during the performance of a mathematical subtraction task.
Figures


Similar articles
-
Epileptic seizure detection in EEG signal with GModPCA and support vector machine.Biomed Mater Eng. 2017;28(2):141-157. doi: 10.3233/BME-171663. Biomed Mater Eng. 2017. PMID: 28372267
-
An efficient detection of epileptic seizure by differentiation and spectral analysis of electroencephalograms.Comput Biol Med. 2015 Nov 1;66:352-6. doi: 10.1016/j.compbiomed.2015.04.034. Epub 2015 May 7. Comput Biol Med. 2015. PMID: 25982199
-
Hidden pattern discovery on epileptic EEG with 1-D local binary patterns and epileptic seizures detection by grey relational analysis.Australas Phys Eng Sci Med. 2015 Sep;38(3):435-46. doi: 10.1007/s13246-015-0362-5. Epub 2015 Jul 24. Australas Phys Eng Sci Med. 2015. PMID: 26206400
-
[Mathematical analyses in the study of electroencephalographic signals].Rev Neurol. 2005 Oct 1-15;41(7):423-34. Rev Neurol. 2005. PMID: 16193448 Review. Spanish.
-
[Assessment of ADHD with EEG].Tidsskr Nor Laegeforen. 2013 Feb 5;133(3):312-6. doi: 10.4045/tidsskr.12.0224. Tidsskr Nor Laegeforen. 2013. PMID: 23381169 Review. Norwegian.
References
Publication types
MeSH terms
LinkOut - more resources
Full Text Sources
Medical
