

Decreased frequency and activated phenotype of blood CD27 IgD IgM B lymphocytes is a permanent abnormality in systemic lupus erythematosus patients
- PMID: 20525218
- PMCID: PMC2911899
- DOI: 10.1186/ar3042
Decreased frequency and activated phenotype of blood CD27 IgD IgM B lymphocytes is a permanent abnormality in systemic lupus erythematosus patients
Abstract
Introduction: Systemic lupus erythematosus (SLE) is characterized by B cell hyper-activation and auto-reactivity resulting in pathogenic auto-antibody generation. The phenotypic analysis of blood B cell subsets can be used to understand these alterations.
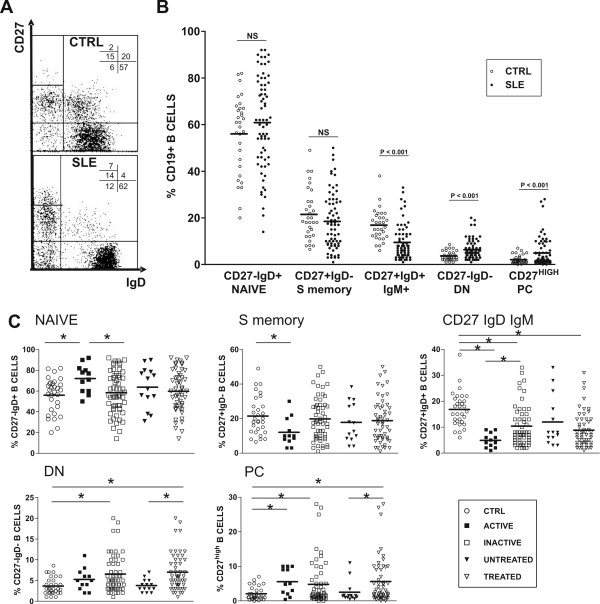
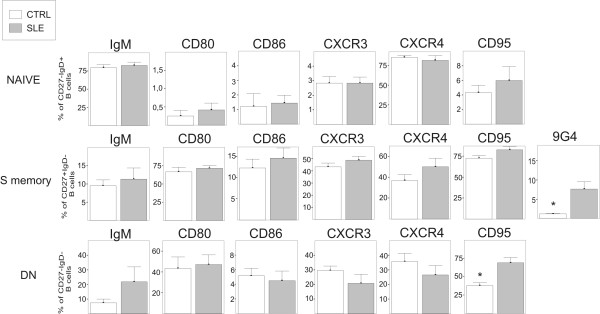
Methods: The combined detection of CD19, CD27 and IgD (or IgM) by flow cytometry (FC) analysis delineates five well-defined blood B cell-subsets: naive, switched (S) memory, double negative (DN) memory and CD27 IgD IgM (non-switched memory) B lymphocytes, and plasma cells (PCs). This phenotypic study was performed in 69 consecutive SLE patients and 31 healthy controls.
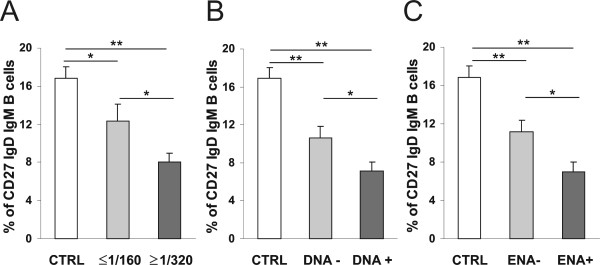
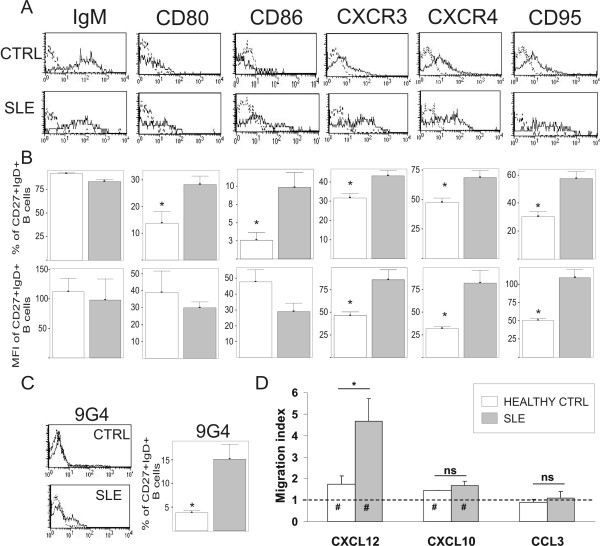
Results: SLE patients exhibited several abnormalities in the distribution of these B cell subsets, including elevated levels of DN memory B cells and PCs, and decreased CD27 IgD IgM B cells. Active SLE patients also showed decreased presence of S memory B cells and increased proportions of naive B lymphocytes. Nevertheless, when the patients in remission who did not require treatment were studied separately, the only remaining abnormality was a reduction of the CD27 IgD IgM B cell-subset detectable in most of these patients. The level of reduction of CD27 IgD IgM B cells was associated with elevated values of serum SLE auto-antibodies. Further analysis of this latter B cell-subset specifically showed increased expression of CD80, CD86, CD95, 9G4 idiotype and functional CXCR3 and CXCR4.
Conclusions: The presence of a reduced blood CD27 IgD IgM B cell-subset, exhibiting an activated state and enriched for auto-reactivity, is a consistent B cell abnormality in SLE. These findings suggest that CD27 IgD IgM B lymphocytes play a role in the pathogenesis of this disease.
Figures
Similar articles
-
Dysfunction of CD27+IgD+ B cells correlates with aggravated systemic lupus erythematosus.Clin Rheumatol. 2022 May;41(5):1551-1559. doi: 10.1007/s10067-022-06051-z. Epub 2022 Jan 15. Clin Rheumatol. 2022. PMID: 35032222
-
Human immunoglobulin (Ig)M+IgD+ peripheral blood B cells expressing the CD27 cell surface antigen carry somatically mutated variable region genes: CD27 as a general marker for somatically mutated (memory) B cells.J Exp Med. 1998 Nov 2;188(9):1679-89. doi: 10.1084/jem.188.9.1679. J Exp Med. 1998. PMID: 9802980 Free PMC article.
-
Differential Expression of IgM and IgD Discriminates Two Subpopulations of Human Circulating IgM+IgD+CD27+ B Cells That Differ Phenotypically, Functionally, and Genetically.Front Immunol. 2020 May 6;11:736. doi: 10.3389/fimmu.2020.00736. eCollection 2020. Front Immunol. 2020. PMID: 32435242 Free PMC article.
-
IgD-CD27- double negative (DN) B cells: Origins and functions in health and disease.Immunol Lett. 2023 Mar;255:67-76. doi: 10.1016/j.imlet.2023.03.003. Epub 2023 Mar 9. Immunol Lett. 2023. PMID: 36906182 Review.
-
The role of double-negative B cells in the pathogenesis of systemic lupus erythematosus.Autoimmun Rev. 2025 Jun 24;24(7):103821. doi: 10.1016/j.autrev.2025.103821. Epub 2025 Apr 23. Autoimmun Rev. 2025. PMID: 40274006 Review.
Cited by
-
IgM Repertoire Biodiversity is Reduced in HIV-1 Infection and Systemic Lupus Erythematosus.Front Immunol. 2013 Nov 15;4:373. doi: 10.3389/fimmu.2013.00373. eCollection 2013. Front Immunol. 2013. PMID: 24298273 Free PMC article.
-
Simultaneous assessment of rotavirus-specific memory B cells and serological memory after B cell depletion therapy with rituximab.PLoS One. 2014 May 12;9(5):e97087. doi: 10.1371/journal.pone.0097087. eCollection 2014. PLoS One. 2014. PMID: 24819618 Free PMC article.
-
Differential effects of cyclophosphamide and mycophenolate mofetil on cellular and serological parameters in patients with systemic lupus erythematosus.Arthritis Res Ther. 2015 Apr 3;17(1):92. doi: 10.1186/s13075-015-0603-8. Arthritis Res Ther. 2015. PMID: 25890338 Free PMC article.
-
Different Types of Chronic Inflammation Engender Distinctive Immunosenescent Profiles in Affected Patients.Int J Mol Sci. 2022 Nov 24;23(23):14688. doi: 10.3390/ijms232314688. Int J Mol Sci. 2022. PMID: 36499016 Free PMC article.
-
The rapid inhibition of B-cell activation markers by belimumab was associated with disease control in systemic lupus erythematosus patients.Front Pharmacol. 2023 Feb 16;14:1080730. doi: 10.3389/fphar.2023.1080730. eCollection 2023. Front Pharmacol. 2023. PMID: 36873989 Free PMC article.
References
-
- Klein U, Rajewsky K, Kuppers R. Human immunoglobulin (Ig)M+IgD+ peripheral blood B cells expressing the CD27 cell surface antigen carry somatically mutated variable region genes: CD27 as a general marker for somatically mutated (memory) B cells. J Exp Med. 1998;188:1679–1689. doi: 10.1084/jem.188.9.1679. - DOI - PMC - PubMed
-
- Odendahl M, Jacobi A, Hansen A, Feist E, Hiepe F, Burmester GR, Lipsky PE, Radbruch A, Dorner T. Disturbed peripheral B lymphocyte homeostasis in systemic lupus erythematosus. J Immunol. 2000;165:5970–5979. - PubMed
Publication types
MeSH terms
Substances
LinkOut - more resources
Full Text Sources
Other Literature Sources
Medical
Research Materials
