

Mapping of quantitative trait loci for flesh colour and growth traits in Atlantic salmon (Salmo salar)
- PMID: 20525320
- PMCID: PMC2900243
- DOI: 10.1186/1297-9686-42-17
Mapping of quantitative trait loci for flesh colour and growth traits in Atlantic salmon (Salmo salar)
Abstract
Background: Flesh colour and growth related traits in salmonids are both commercially important and of great interest from a physiological and evolutionary perspective. The aim of this study was to identify quantitative trait loci (QTL) affecting flesh colour and growth related traits in an F2 population derived from an isolated, landlocked wild population in Norway (Byglands Bleke) and a commercial production population.
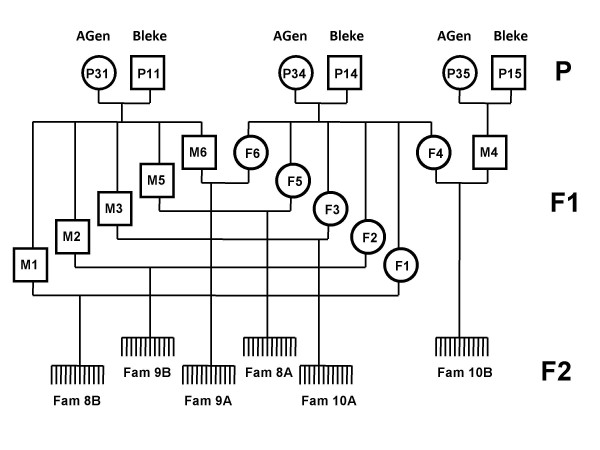
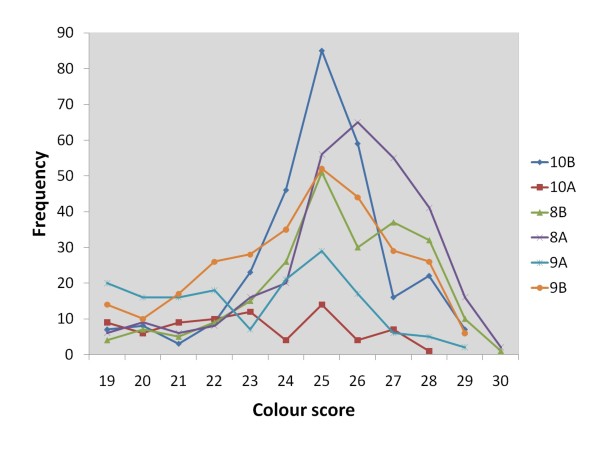
Methods: One hundred and twenty-eight informative microsatellite loci distributed across all 29 linkage groups in Atlantic salmon were genotyped in individuals from four F2 families that were selected from the ends of the flesh colour distribution. Genotyping of 23 additional loci and two additional families was performed on a number of linkage groups harbouring putative QTL. QTL analysis was performed using a line-cross model assuming fixation of alternate QTL alleles and a half-sib model with no assumptions about the number and frequency of QTL alleles in the founder populations.
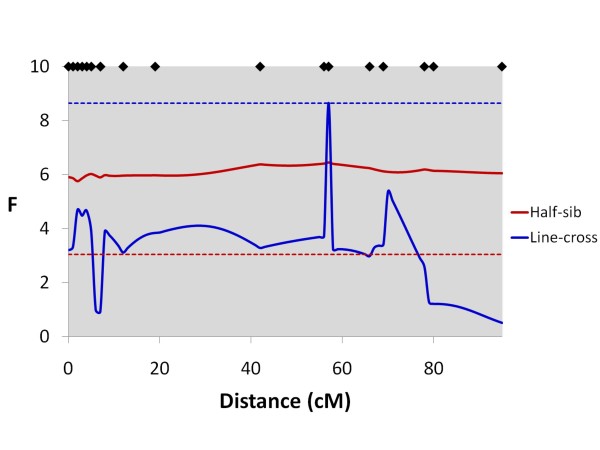
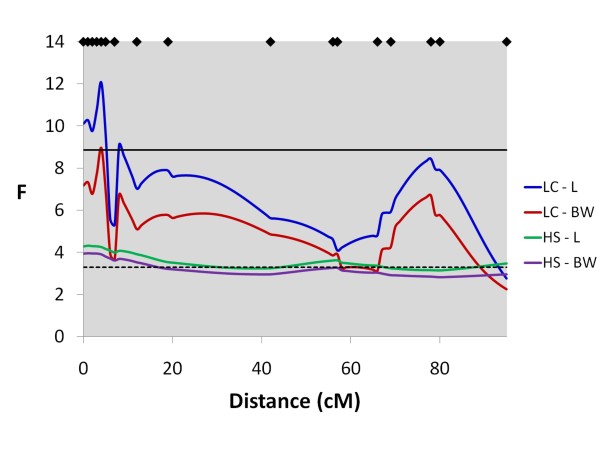
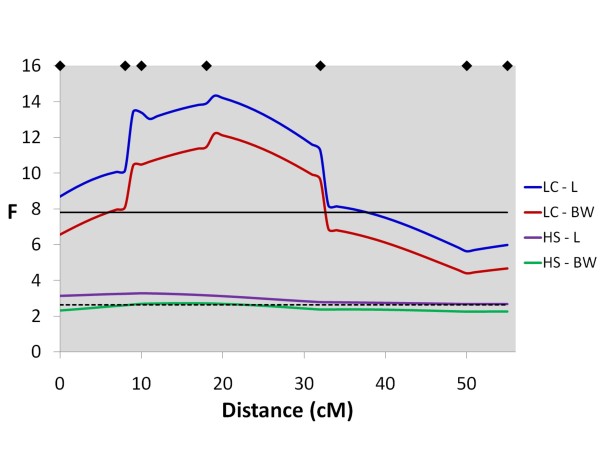
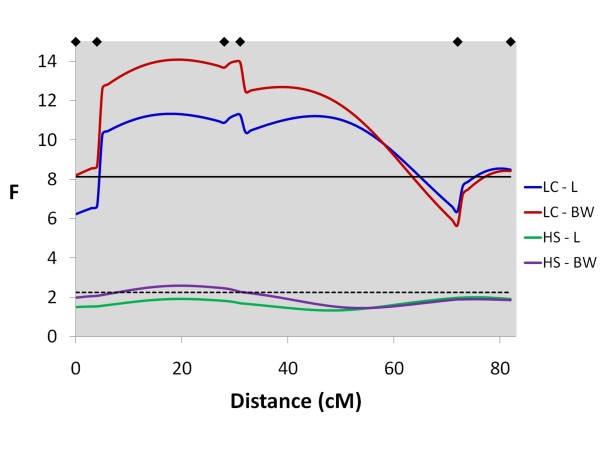
Results: A moderate to strong phenotypic correlation was found between colour, length and weight traits. In total, 13 genome-wide significant QTL were detected for all traits using the line-cross model, including three genome-wide significant QTL for flesh colour (Chr 6, Chr 26 and Chr 4). In addition, 32 suggestive QTL were detected (chromosome-wide P < 0.05). Using the half-sib model, six genome-wide significant QTL were detected for all traits, including two for flesh colour (Chr 26 and Chr 4) and 41 suggestive QTL were detected (chromosome-wide P < 0.05). Based on the half-sib analysis, these two genome-wide significant QTL for flesh colour explained 24% of the phenotypic variance for this trait.
Conclusions: A large number of significant and suggestive QTL for flesh colour and growth traits were found in an F2 population of Atlantic salmon. Chr 26 and Chr 4 presented the strongest evidence for significant QTL affecting flesh colour, while Chr 10, Chr 5, and Chr 4 presented the strongest evidence for significant QTL affecting growth traits (length and weight). These QTL could be strong candidates for use in marker-assisted selection and provide a starting point for further characterisation of the genetic components underlying flesh colour and growth.
Figures

Similar articles
-
The genetic architecture of growth and fillet traits in farmed Atlantic salmon (Salmo salar).BMC Genet. 2015 May 19;16:51. doi: 10.1186/s12863-015-0215-y. BMC Genet. 2015. PMID: 25985885 Free PMC article.
-
Confirmation and fine-mapping of a major QTL for resistance to infectious pancreatic necrosis in Atlantic salmon (Salmo salar): population-level associations between markers and trait.BMC Genomics. 2009 Aug 7;10:368. doi: 10.1186/1471-2164-10-368. BMC Genomics. 2009. PMID: 19664221 Free PMC article.
-
Mapping of a quantitative trait locus for resistance against infectious salmon anaemia in Atlantic salmon (Salmo salar): comparing survival analysis with analysis on affected/resistant data.BMC Genet. 2007 Aug 14;8:53. doi: 10.1186/1471-2156-8-53. BMC Genet. 2007. PMID: 17697344 Free PMC article.
-
Atlantic salmon (Salmo salar L.) genetics in the 21st century: taking leaps forward in aquaculture and biological understanding.Anim Genet. 2019 Feb;50(1):3-14. doi: 10.1111/age.12748. Epub 2018 Nov 14. Anim Genet. 2019. PMID: 30426521 Free PMC article. Review.
-
Genetic Mapping of Quantitative Trait Loci for Egg Production and Egg Quality Traits in Chickens: a Review.J Poult Sci. 2017 Jan 25;54(1):1-12. doi: 10.2141/jpsa.0160121. J Poult Sci. 2017. PMID: 32908402 Free PMC article. Review.
Cited by
-
Genome-wide association identifies genomic regions influencing fillet color in Northwest Atlantic salmon (Salmo salar Linnaeus 1758).Front Genet. 2024 Jul 26;15:1402927. doi: 10.3389/fgene.2024.1402927. eCollection 2024. Front Genet. 2024. PMID: 39130751 Free PMC article.
-
Identification of Single-Nucleotide Polymorphisms in Differentially Expressed Genes Favoring Soybean Meal Tolerance in Higher-Growth Zebrafish (Danio rerio).Mar Biotechnol (NY). 2024 Aug;26(4):754-765. doi: 10.1007/s10126-024-10343-7. Epub 2024 Jul 3. Mar Biotechnol (NY). 2024. PMID: 38958822
-
Host-gut microbiota interactions shape parasite infections in farmed Atlantic salmon.mSystems. 2024 Feb 20;9(2):e0104323. doi: 10.1128/msystems.01043-23. Epub 2024 Jan 31. mSystems. 2024. PMID: 38294254 Free PMC article.
-
A draft genome of the striped catfish, Pangasianodon hypophthalmus, for comparative analysis of genes relevant to development and a resource for aquaculture improvement.BMC Genomics. 2018 Oct 5;19(1):733. doi: 10.1186/s12864-018-5079-x. BMC Genomics. 2018. PMID: 30290758 Free PMC article.
-
Teleosts Genomics: Progress and Prospects in Disease Prevention and Control.Int J Mol Sci. 2018 Apr 4;19(4):1083. doi: 10.3390/ijms19041083. Int J Mol Sci. 2018. PMID: 29617353 Free PMC article. Review.
References
-
- Gjerde B, Schaeffer LR. Body traits in rainbow trout: II. Estimates of heritabilities and of phenotypic and genetic correlations. Aquaculture. 1989;80:25–44. doi: 10.1016/0044-8486(89)90271-8. - DOI
-
- Quinton CD, McMillan I, Glebe BD. Development of an Atlantic salmon (Salmo salar) genetic improvement program: Genetic parameters of harvest body weight and carcass quality traits estimated with animal models. Aquaculture. 2005;247:211–217. doi: 10.1016/j.aquaculture.2005.02.030. - DOI
-
- Iwamoto RN, Myers JM, Hershberger WK. Heritability and genetic correlations for flesh coloration in pen-reared coho salmon. Aquaculture. 1990;86:181–190. doi: 10.1016/0044-8486(90)90111-Y. - DOI
-
- Torissen OJ, Hardy RW, Shearer KD. Pigmentation of salmonids- carotenoid deposition and metabolism. Crit Rev Aquat Sci. 1989;1:209–225.
-
- Nickell DC, Bromage NR. The effect of timing and duration of feeding astaxanthin on the development and variation of fillet colour and efficiency of pigmentation in rainbow trout (Oncorhynchus mykiss) Aquaculture. 1998;169:233–246. doi: 10.1016/S0044-8486(98)00385-8. - DOI
Publication types
MeSH terms
LinkOut - more resources
Full Text Sources
Other Literature Sources
Miscellaneous
