. 2010 Jun 4:4:78.
doi: 10.1186/1752-0509-4-78.

Network properties of human disease genes with pleiotropic effects

Affiliations

Network properties of human disease genes with pleiotropic effects

Sreenivas Chavali et al. BMC Syst Biol. .

Abstract

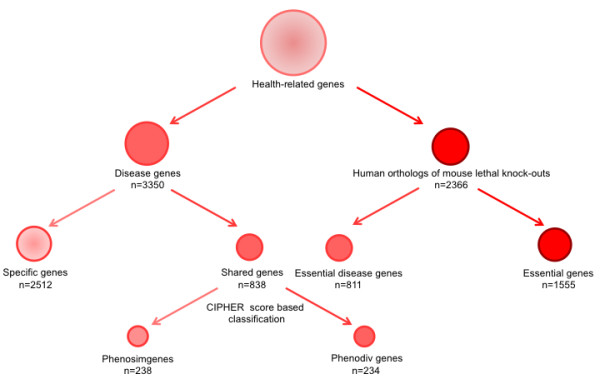
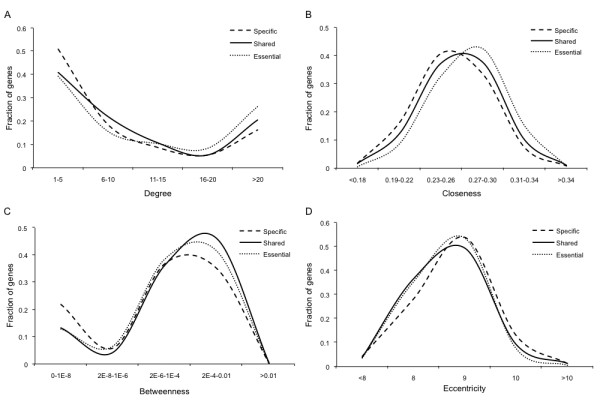
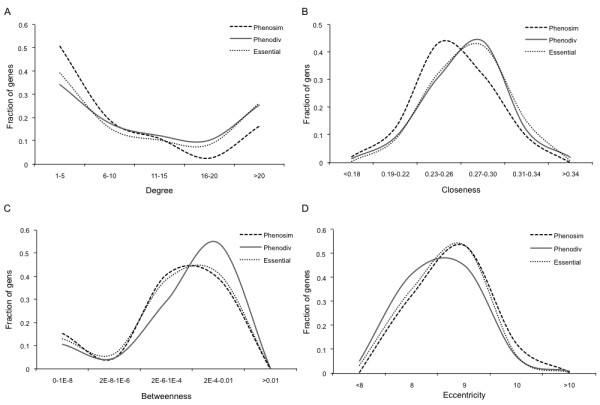
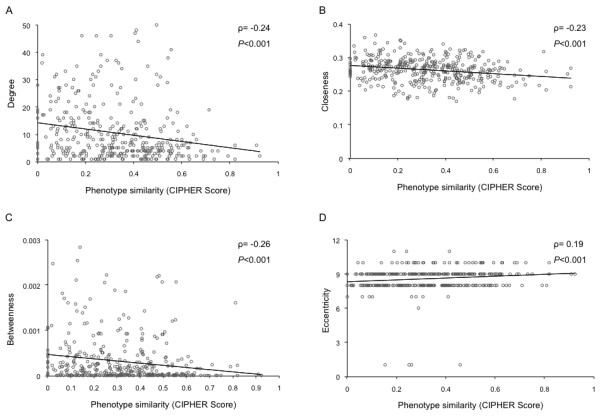
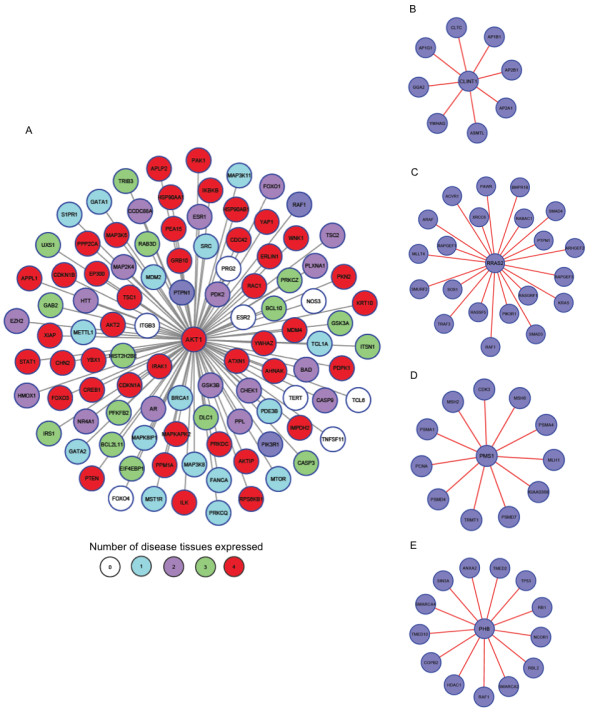
Background: The ability of a gene to cause a disease is known to be associated with the topological position of its protein product in the molecular interaction network. Pleiotropy, in human genetic diseases, refers to the ability of different mutations within the same gene to cause different pathological effects. Here, we hypothesized that the ability of human disease genes to cause pleiotropic effects would be associated with their network properties.

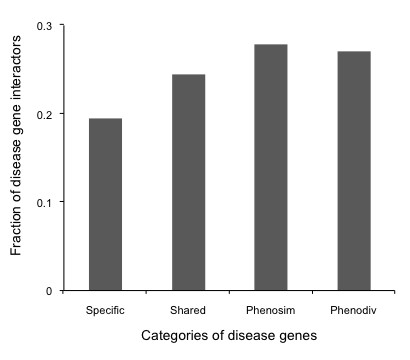
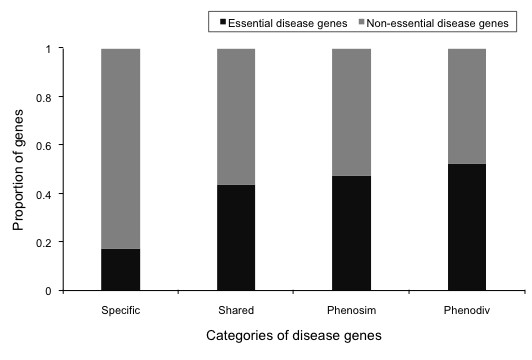
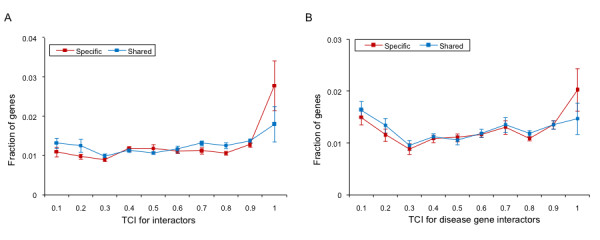
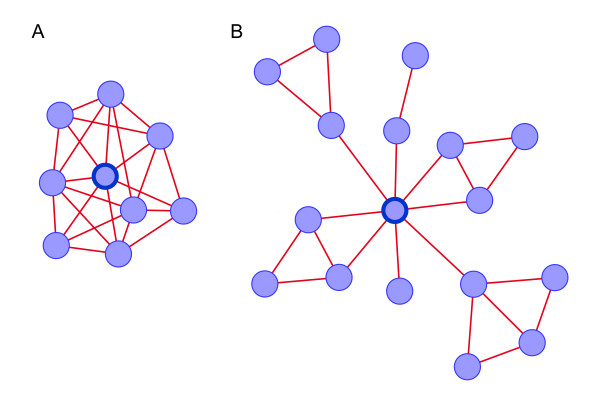
Results: Shared genes, with pleiotropic effects, were more central than specific genes that were associated with one disease, in the protein interaction network. Furthermore, shared genes associated with phenotypically divergent diseases (phenodiv genes) were more central than those associated with phenotypically similar diseases. Shared genes had a higher number of disease gene interactors compared to specific genes, implying higher likelihood of finding a novel disease gene in their network neighborhood. Shared genes had a relatively restricted tissue co-expression with interactors, contrary to specific genes. This could be a function of shared genes leading to pleiotropy. Essential and phenodiv genes had comparable connectivities and hence we investigated for differences in network attributes conferring lethality and pleiotropy, respectively. Essential and phenodiv genes were found to be intra-modular and inter-modular hubs with the former being highly co-expressed with their interactors contrary to the latter. Essential genes were predominantly nuclear proteins with transcriptional regulation activities while phenodiv genes were cytoplasmic proteins involved in signal transduction.

Conclusion: The properties of a disease gene in molecular interaction network determine its role in manifesting different and divergent diseases.


Figures

Figure 1
Figure 1
Flow chart detailing how the different classes of genes were derived for this study.
Figure 2
Figure 2
Distribution profiles of measures of centrality A) Degree, B) Closeness, C) Betweenness and D) Eccentricity among the specific, shared and essential genes. Shared genes show intermediate measures of centrality between essential genes and specific genes in human protein interaction network. Statistical comparisons of the measures of centrality between specific, shared and essential genes are presented in tables 1 and 2.
Figure 3
Figure 3
Distribution profiles of measures of centrality A) Degree, B) Closeness, C) Betweenness and D) Eccentricity among the phenosim, phenodiv and essential genes. Phenodiv genes have higher measures of centrality compared to Phenosim genes. Phenodiv genes have comparable measures of centrality to essential genes except higher betweenness. Statistical comparisons of the measures of centrality between phenosim, phenodiv and essential genes are presented in tables 1 and 2.
Figure 4
Figure 4
Correlation of measures of centrality. A) Degree, B) Closeness, C) Betweenness, D) Eccentricity with phenotypic similarity estimated by CIPHER Score. ρ represents Spearman's rho. The trend lines with negative slope in panels A, B and C indicate negative correlation of degree, closeness and betweenness with phenotypic similarity with the corresponding correlation coefficient and significance. The positive slope of the trend line in panel D demonstrates a positive correlation between eccentricity and phenotypic similarity. Thus, with the increasing phenotypic similarity, the respective disease associated genes show decreasing centrality. Very high degree values in the panel A have been removed in order to aid better visualization; however they have been considered for estimating correlation.
Figure 5
Figure 5
Fraction of disease-gene interactors among those that interact with the four categories of disease genes. Phenodiv and Phenosim genes have the highest number of disease-gene interactors while specific genes have the least.
Figure 6
Figure 6
Proportion of essential disease genes in the four categories of human disease genes. Essential disease genes are defined as the orthologs of mouse genes that resulted in lethal phenotype upon knock-out, mutations in which lead to diseases in humans. Phenodiv genes have the highest number of essential disease genes while specific have the least.
Figure 7
Figure 7
Tissue co-expression of specific and shared genes with A) All interactors and B) Disease gene interactors. The Tissue Co-expression Index (TCI) was calculated for a disease gene and its interactor as the fraction of the 79 tissues analyzed in which both were detected as expressed. Larger indices indicate that disease gene and the interactor are co-expressed in most tissues. The fractions of disease genes shown as the function of TCI indicate that specific genes are more co-expressed with their interactors as well as disease gene interactors compared to shared genes. The error bars represent SEM.
Figure 8
Figure 8
A simplified illustration of the topological position of the protein product of A) Essential gene (Intra-modular hub) and B) phenodiv gene (Inter-modular hub) in the molecular interaction network. The representative essential and phenodiv genes are marked in solid blue color node border. Both the classes of genes have same connectivities. Phenodiv genes have higher betweenness implying that these are proteins that occur on many shortest paths between other proteins in protein interaction network. On the other hand, essential genes have higher clustering coefficient suggesting the increased overall tendency of its interactors to form clusters.
Figure 9
Figure 9
Networks of interactors of disease genes in disease tissues. A) Network of interactors of the phenodiv gene AKT1 which is associated with schizophrenia, ovarian cancer, colorectal cancer and breast cancer. The color of the nodes indicates the number of disease tissues in which the interactors are expressed in. As indicated by the co-expression of interactors, AKT1 interacts with diverse interactors under different pathological conditions. AKT1 as a specific example of phenodiv genes demonstrates that phenodiv genes have more interactors (higher connectivity) and show relatively restricted co-expression with their interactors across different tissues. Network of interactors of specific genes- B) CLINT1 C) RRAS2 D) PMS1 and E) PHB associated with schizophrenia, ovarian cancer, colorectal cancer and breast cancer respectively. As has been observed for the class of specific genes, CLINT1, RRAS2, PMS1 and PHB have lesser number of interactors and are co-expressed with all their interactors in the respective disease tissue.

References

    1. Jimenez-Sanchez G, Childs B, Valle D. Human disease genes. Nature. 2001;409:853–855. doi: 10.1038/35057050. - DOI - PubMed
    1. Peltonen L, McKusick VA. Genomics and medicine. Dissecting human disease in the postgenomic era. Science. 2001;291:1224–1229. doi: 10.1126/science.291.5507.1224. - DOI - PubMed
    1. McKusick VA. Mendelian Inheritance in Man and its online version, OMIM. Am J Hum Genet. 2007;80:588–604. doi: 10.1086/514346. - DOI - PMC - PubMed
    1. Goh KI, Cusick ME, Valle D, Childs B, Vidal M, Barabási AL. The human disease network. Proc Natl Acad Sci USA. 2007;104:8685–8690. doi: 10.1073/pnas.0701361104. - DOI - PMC - PubMed
    1. Feldman I, Rzhetsky A, Vitkup D. Network properties of genes harboring inherited disease mutations. Proc Natl Acad Sci USA. 2008;105:4323–4328. doi: 10.1073/pnas.0701722105. - DOI - PMC - PubMed

Publication types