

Copy number variation and cytidine analogue cytotoxicity: a genome-wide association approach
- PMID: 20525348
- PMCID: PMC2894803
- DOI: 10.1186/1471-2164-11-357
Copy number variation and cytidine analogue cytotoxicity: a genome-wide association approach
Abstract
Background: The human genome displays extensive copy-number variation (CNV). Recent discoveries have shown that large segments of DNA, ranging in size from hundreds to thousands of nucleotides, are either deleted or duplicated. This CNV may encompass genes, leading to a change in phenotype, including drug response phenotypes. Gemcitabine and 1-beta-D-arabinofuranosylcytosine (AraC) are cytidine analogues used to treat a variety of cancers. Previous studies have shown that genetic variation may influence response to these drugs. In the present study, we set out to test the hypothesis that variation in copy number might contribute to variation in cytidine analogue response phenotypes.
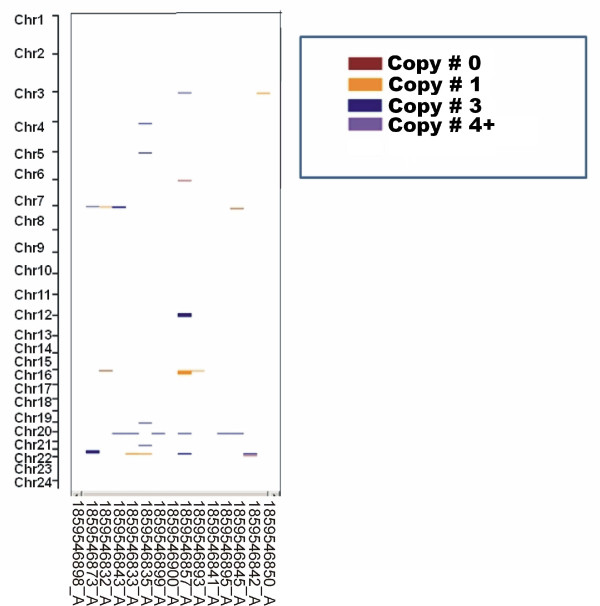
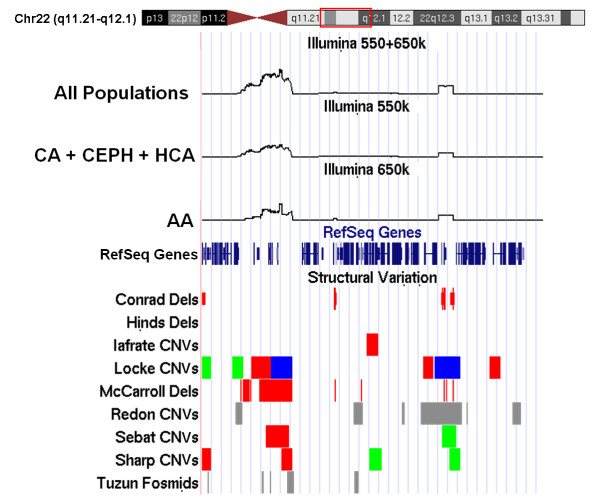
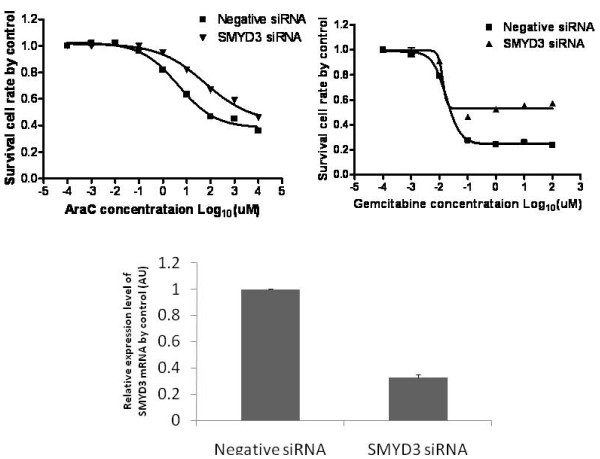
Results: We used a cell-based model system consisting of 197 ethnically-defined lymphoblastoid cell lines for which genome-wide SNP data were obtained using Illumina 550 and 650 K SNP arrays to study cytidine analogue cytotoxicity. 775 CNVs with allele frequencies > 1% were identified in 102 regions across the genome. 87/102 of these loci overlapped with previously identified regions of CNV. Association of CNVs with gemcitabine and AraC IC50 values identified 11 regions with permutation p-values < 0.05. Multiplex ligation-dependent probe amplification assays were performed to verify the 11 CNV regions that were associated with this phenotype; with false positive and false negative rates for the in-silico findings of 1.3% and 0.04%, respectively. We also had basal mRNA expression array data for these same 197 cell lines, which allowed us to quantify mRNA expression for 41 probesets in or near the CNV regions identified. We found that 7 of those 41 genes were highly expressed in our lymphoblastoid cell lines, and one of the seven genes (SMYD3) that was significant in the CNV association study was selected for further functional experiments. Those studies showed that knockdown of SMYD3, in pancreatic cancer cell lines increased gemcitabine and AraC resistance during cytotoxicity assay, consistent with the results of the association analysis.
Conclusions: These results suggest that CNVs may play a role in variation in cytidine analogue effect. Therefore, association studies of CNVs with drug response phenotypes in cell-based model systems, when paired with functional characterization, might help to identify CNV that contributes to variation in drug response.
Figures
Similar articles
-
Gemcitabine and arabinosylcytosin pharmacogenomics: genome-wide association and drug response biomarkers.PLoS One. 2009 Nov 9;4(11):e7765. doi: 10.1371/journal.pone.0007765. PLoS One. 2009. PMID: 19898621 Free PMC article.
-
Gemcitabine and cytosine arabinoside cytotoxicity: association with lymphoblastoid cell expression.Cancer Res. 2008 Sep 1;68(17):7050-8. doi: 10.1158/0008-5472.CAN-08-0405. Cancer Res. 2008. PMID: 18757419 Free PMC article.
-
Discovery of genetic biomarkers contributing to variation in drug response of cytidine analogues using human lymphoblastoid cell lines.BMC Genomics. 2014 Feb 1;15:93. doi: 10.1186/1471-2164-15-93. BMC Genomics. 2014. PMID: 24483146 Free PMC article.
-
[DNA polymorphisms].Rinsho Byori. 2013 Nov;61(11):1001-7. Rinsho Byori. 2013. PMID: 24450105 Review. Japanese.
-
Intracellular Pharmacokinetics of Pyrimidine Analogues used in Oncology and the Correlation with Drug Action.Clin Pharmacokinet. 2020 Dec;59(12):1521-1550. doi: 10.1007/s40262-020-00934-7. Clin Pharmacokinet. 2020. PMID: 33064276 Free PMC article. Review.
Cited by
-
Targeting histone methylation for cancer therapy: enzymes, inhibitors, biological activity and perspectives.J Hematol Oncol. 2016 Jun 17;9(1):49. doi: 10.1186/s13045-016-0279-9. J Hematol Oncol. 2016. PMID: 27316347 Free PMC article. Review.
-
Statistical tests for detecting variance effects in quantitative trait studies.Bioinformatics. 2019 Jan 15;35(2):200-210. doi: 10.1093/bioinformatics/bty565. Bioinformatics. 2019. PMID: 29982387 Free PMC article.
-
Hidden Markov Model-Based CNV Detection Algorithms for Illumina Genotyping Microarrays.Cancer Inform. 2015 Jan 27;13(Suppl 7):77-83. doi: 10.4137/CIN.S16345. eCollection 2014. Cancer Inform. 2015. PMID: 25657572 Free PMC article. Review.
-
Current progress in pharmacogenetics.Br J Clin Pharmacol. 2011 Jun;71(6):824-31. doi: 10.1111/j.1365-2125.2011.03912.x. Br J Clin Pharmacol. 2011. PMID: 21235621 Free PMC article. Review.
-
Lymphoblastoid cell lines in pharmacogenomic discovery and clinical translation.Pharmacogenomics. 2012 Jan;13(1):55-70. doi: 10.2217/pgs.11.121. Pharmacogenomics. 2012. PMID: 22176622 Free PMC article. Review.
References
-
- Aklillu E, Persson I, Bertilsson L, Johansson I, Rodrigues F, Ingelman-Sundberg M. Frequent distribution of ultrarapid metabolizers of debrisoquine in an ethiopian population carrying duplicated and multiduplicated functional CYP2D6 alleles. J Pharmacol Exp Ther. 1996;278(1):441–446. - PubMed
-
- Dahl ML, Johansson I, Bertilsson L, Ingelman-Sundberg M, Sjoqvist F. Ultrarapid hydroxylation of debrisoquine in a Swedish population. Analysis of the molecular genetic basis. J Pharmacol Exp Ther. 1995;274(1):516–520. - PubMed
-
- Johansson I, Lundqvist E, Bertilsson L, Dahl ML, Sjoqvist F, Ingelman-Sundberg M. Inherited amplification of an active gene in the cytochrome P450 CYP2D locus as a cause of ultrarapid metabolism of debrisoquine. Proc Natl Acad Sci USA. 1993;90(24):11825–11829. doi: 10.1073/pnas.90.24.11825. - DOI - PMC - PubMed
Publication types
MeSH terms
Substances
Grants and funding
LinkOut - more resources
Full Text Sources
Other Literature Sources
Molecular Biology Databases
