. 2010 Jun 4:11:69.
doi: 10.1186/1471-2202-11-69.

Intrinsic response of thoracic propriospinal neurons to axotomy

Affiliations

Intrinsic response of thoracic propriospinal neurons to axotomy

Justin R Siebert et al. BMC Neurosci. .

Abstract

Background: Central nervous system axons lack a robust regenerative response following spinal cord injury (SCI) and regeneration is usually abortive. Supraspinal pathways, which are the most commonly studied for their regenerative potential, demonstrate a limited regenerative ability. On the other hand, propriospinal (PS) neurons, with axons intrinsic to the spinal cord, have shown a greater regenerative response than their supraspinal counterparts, but remain relatively understudied in regards to spinal cord injury.

Results: Utilizing laser microdissection, gene-microarray, qRT-PCR, and immunohistochemistry, we focused on the intrinsic post-axotomy response of specifically labelled thoracic propriospinal neurons at periods from 3-days to 1-month following T9 spinal cord injury. We found a strong and early (3-days post injury, p.i) upregulation in the expression of genes involved in the immune/inflammatory response that returned towards normal by 1-week p.i. In addition, several regeneration associated and cell survival/neuroprotective genes were significantly up-regulated at the earliest p.i. period studied. Significant upregulation of several growth factor receptor genes (GFRa1, Ret, Lifr) also occurred only during the initial period examined. The expression of a number of pro-apoptotic genes up-regulated at 3-days p.i. suggest that changes in gene expression after this period may have resulted from analyzing surviving TPS neurons after the cell death of the remainder of the axotomized TPS neuronal population.

Conclusions: Taken collectively these data demonstrate that thoracic propriospinal (TPS) neurons mount a very dynamic response following low thoracic axotomy that includes a strong regenerative response, but also results in the cell death of many axotomized TPS neurons in the first week after spinal cord injury. These data also suggest that the immune/inflammatory response may have an important role in mediating the early strong regenerative response, as well as the apoptotic response, since expression of all of three classes of gene are up-regulated only during the initial period examined, 3-days post-SCI. The up-regulation in the expression of genes for several growth factor receptors during the first week post-SCI also suggest that administration of these factors may protect TPS neurons from cell death and maintain a regenerative response, but only if given during the early period after injury.


Figures

Figure 1
Figure 1
Laser microdissection of thoracic propriospinal (TPS) neurons for microarray analysis. A, TPS neurons selected for microdissection were located within laminae V, VII, VIII, and X of the thoracic spinal cord. B, Thoracic propriospinal (TPS) neurons retrogradely labeled by fluorogold (FG) injections into the lumbosacral enlargement are shown at 10 × magnification under an ultraviolet filter. The white dashed line marks the boundary of the white and gray matter, while the yellow dashed line outlines the laminae area from which neurons were collected. C, Region from which a FG labeled TPS had been individually laser microdissected yielding a relatively pure TPS neuron RNA message. Figure 1a was adapted from: The Spinal Cord (Watson C, Paxinos G, Kayalioglu G ed.) p 270, New York, Academic Press
Figure 2
Figure 2
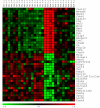
Genetic expression profiles for the top 20 genes up-regulated and down-regulated following spinal transection. The expression profiles illustrate the normalized log2 expression values with low expression values being represented by green and high expression in red. The 20 genes exhibiting the greatest up-or down- regulation were determined by using a 2-way ANOVA comparing the effects of treatment across post-operative survival points. The resulting P values from the main effect ANOVA were Benjamini-Hochberg corrected for multiple testing. Further investigation of the top 20-upregulated genes revealed a majority of them were either involved or associated with immune function and inflammation, or in cell maintenance and survival (Table 2.2). The top 20 genes down-regulated were mainly involved in different aspects of neuron cell biology. As illustrated in this expression profile, the maximal response (up- or down-regulation) is found during the first, three day, post-injury interval (Post 1.1-1.4). As time progresses, gene expression levels begin to wane (Post 2.1-2.4) returning to levels near to that seen in non-injured control animals by 1-month post-injury (Post 4.1-4.2). This overall analysis of the TPS response to a low thoracic injury suggests that the immune and inflammatory response plays a major role in the early post-injury response of TPS neurons.
Figure 3
Figure 3
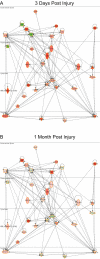
Ingenuity Pathway Assist (IPA) analysis of significant genes involved in cell death. Data sets for each time point were uploaded to IPA that consisted of all the genes changed at the Benjamini-Hochberg FDR-corrected P value of 0.05 or less. These data sets were then filtered using IPA software (See Materials and Methods). IPA biological/gene network analysis indicates the interaction of groups of genes with one another and how their expression decreases (in green) or increases (in red) over time. In addition to the visualization of the gene interactions, IPA analysis shows the sub-cellular localization of each of the molecules. See text for details. For conventions and symbols, refer to Ingenuity website legend description https://analysis.ingenuity.com/pa/info/help/help.htm#legend.htm.
Figure 4
Figure 4
Expression profiles of specific genes classes significantly altered following spinal transection. The expression profiles illustrate the normalized log2 expression values with low expression values being represented by green and high expression in red. The three expression profiles illustrated here were generated using a combination 2-factor ANVOA with a significance of (p = 0.01, based on 1000 permutations) and cluster analysis to reveal the expression patterns. A, Expression profiles for 14 of the 84 genes associated with regeneration (RAG) or cell survival and neuroprotection (CsNp) using the ANOVA analysis demonstrated a significant change in expression following injury. As shown, all were upregulated. B, The expression profile for genes associated with surface receptors, neurotrophic receptors, and neurotrophins and growth factors (GF). ANOVA analysis revealed 8 of the 214 genes examined exhibited a significant change in expression following the injury, 3 of which (Unc5a, Lingo1, Fgf9) are down-regulated. C, Even though both pro- and anti-apoptotic genes were included, all seven genes revealed by this analysis are pro-apoptotic. Only one of the seven genes is down regulated (Siva1), while the other 6 demonstrate a sharp up-regulation following axotomy. A, B, C All three-expression profiles have a common pattern in gene expression that matches the pattern found for the overall significant response (see Figure 2). Asterisk indicates genes from the genome wide hypothesis free analysis also identified in our specific gene programs. Plus sign indicates genes whose expression values were validated by qRT-PCR. Black circle indicates genes validated immunofluorescently.
Figure 5
Figure 5
PCR validation of gene expression data. A, The log2 difference was obtained to give the direction of change in the expression values. B, P values for the significance in change of expression were determined using a two-tailed student t-test, for each time point comparison. A, B, Values appearing both bolded and italicized are genes demonstrating a significant change in expression (P-value). F, A correlation analysis between the log2 differences of expression in gene array and PCR array was run to see if the expression trends observed in the gene array data corroborated the expression trends displayed in the PCR array. The overall correlation of 0.69 reveals a reasonable. C, D, E, The top three correlated genes (Hspb1, Gfra1, Gfra2) are plotted to illustrate the correlated expression trends between the log2 differences of the gene array data and PCR data. G, Summary of the data presented in panels A, B and F. Genes demonstrating a significant and correlated change in expression following injury in both the gene and PCR arrays are indicated in red (Actb, Fgf9, Gfra1, Hspb1). Genes with a significant change in expression in either the gene array or PCR array and demonstrate correlated expression trends are indicated in pink. Time points where no significant change in expression was found, but a correlation of expression between the two arrays is found are indicated in purple, The one time point where a significance in change of expression is found but the expression trends diverge is indicated in black.
Figure 6
Figure 6
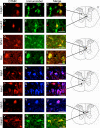
Immunofluorescent analysis of the TPS neuronal response to a low thoracic contusion injury 1-week post-injury. A, D, G, J, M, P, S, V, TPS neurons were retrogradely labeled by bilateral injections into the intermediate gray matter of the upper lumbosacral enlargement with DTMR 4 days prior to the injury, and 1-week following injury in cryostat sections (Cy3 Filter). B, E, H, K, N, Q, T, W, These sections also were immunolabeled by 1 of 8 antibodies. Examples show immuno-labeling within thoracic neurons (FITC Filter) related to cell survival, Hspb1; regeneration, Gap43; growth factor receptors, Gfra1, Ret, Ntrk1, Ntrk2, Ntrk3; and apoptosis, Casp3. C, F, I, L, O, R, U, X, TPS neurons colocalizing with the immuno-label for all 8 proteins are shown in these merged images. Y, Cartoons show the region of the intermediate gray matter from which the digital images were taken. All images taken at 40x; Scale bars = 100 μm.

Similar articles

Cited by

References

    1. Fawcett JW, Asher AA. The glial scar and central nervous system repair. Brain Res Bull. 1999;49(6):227–391. doi: 10.1016/S0361-9230(99)00072-6. - DOI - PubMed
    1. Profyris C, Cheema SS, Zang D, Azari M, Boyle K, Petratos S. Degenerative and regenerative mechanisms governing spinal cord injury. Neurobiol Dis. 2004;15:415–436. doi: 10.1016/j.nbd.2003.11.015. - DOI - PubMed
    1. Yie G, He Z. Glial inhibition of CNS axon regeneration. Nature Rev Neurosci. 2006;7:617–627. doi: 10.1038/nrn1956. - DOI - PMC - PubMed
    1. Hiebert GW, Khodarahmi K, McGraw J, Steeves JD, Tetzlaff W. Brain-Derived Neurotrophic Factor Applied to the Motor Cortex Promotes Sprouting of Corticospinal Fibers but not regeneration Into a Peripheral Nerve Transplant. J Neurosci Res. 2002;69:160–168. doi: 10.1002/jnr.10275. - DOI - PubMed
    1. Bareyre FM. Neuronal repair and replacement in spinal cord injury. J Neurol Sci. 2008;265:63–72. doi: 10.1016/j.jns.2007.05.004. - DOI - PubMed

Publication types