

WAMI: a web server for the analysis of minisatellite maps
- PMID: 20525398
- PMCID: PMC2897807
- DOI: 10.1186/1471-2148-10-167
WAMI: a web server for the analysis of minisatellite maps
Abstract
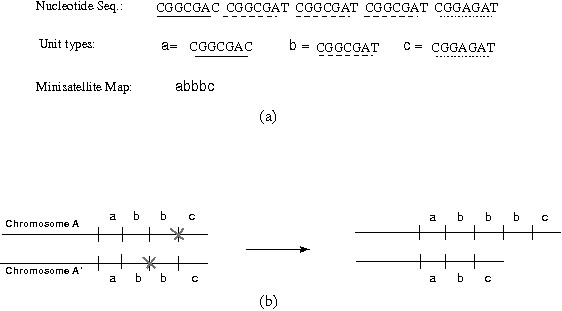
Background: Minisatellites are genomic loci composed of tandem arrays of short repetitive DNA segments. A minisatellite map is a sequence of symbols that represents the tandem repeat array such that the set of symbols is in one-to-one correspondence with the set of distinct repeats. Due to variations in repeat type and organization as well as copy number, the minisatellite maps have been widely used in forensic and population studies. In either domain, researchers need to compare the set of maps to each other, to build phylogenetic trees, to spot structural variations, and to study duplication dynamics. Efficient algorithms for these tasks are required to carry them out reliably and in reasonable time.
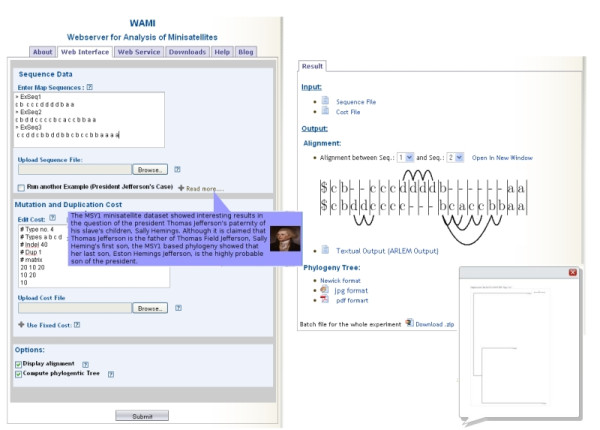
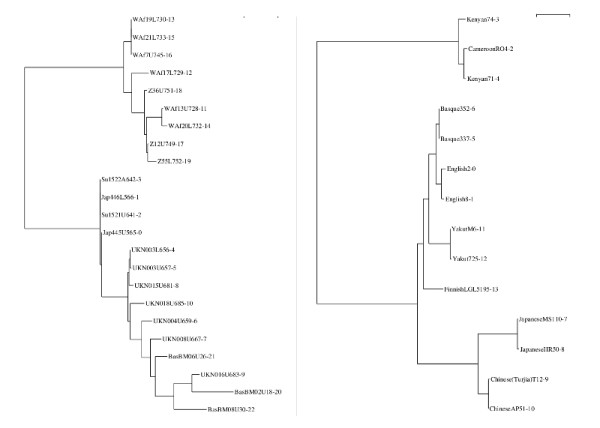
Results: In this paper we present WAMI, a web-server for the analysis of minisatellite maps. It performs the above mentioned computational tasks using efficient algorithms that take the model of map evolution into account. The WAMI interface is easy to use and the results of each analysis task are visualized.
Conclusions: To the best of our knowledge, WAMI is the first server providing all these computational facilities to the minisatellite community. The WAMI web-interface and the source code of the underlying programs are available at http://www.nubios.nileu.edu.eg/tools/wami.
Figures
Similar articles
-
Comparison of minisatellites.J Comput Biol. 2003;10(3-4):357-72. doi: 10.1089/10665270360688066. J Comput Biol. 2003. PMID: 12935333
-
Alignment of minisatellite maps based on run-length encoding scheme.J Bioinform Comput Biol. 2009 Apr;7(2):287-308. doi: 10.1142/s0219720009004060. J Bioinform Comput Biol. 2009. PMID: 19340916
-
PhyloBot: A Web Portal for Automated Phylogenetics, Ancestral Sequence Reconstruction, and Exploration of Mutational Trajectories.PLoS Comput Biol. 2016 Jul 29;12(7):e1004976. doi: 10.1371/journal.pcbi.1004976. eCollection 2016 Jul. PLoS Comput Biol. 2016. PMID: 27472806 Free PMC article.
-
MultiPipMaker: comparative alignment server for multiple DNA sequences.Curr Protoc Bioinformatics. 2005 Apr;Chapter 10:Unit10.4. doi: 10.1002/0471250953.bi1004s9. Curr Protoc Bioinformatics. 2005. PMID: 18428743
-
Practical informatics approaches to microsatellite and variable number tandem repeat analysis.Methods Mol Biol. 2010;628:181-94. doi: 10.1007/978-1-60327-367-1_10. Methods Mol Biol. 2010. PMID: 20238082 Review.
Cited by
-
Functional and Genome Sequence-Driven Characterization of tal Effector Gene Repertoires Reveals Novel Variants With Altered Specificities in Closely Related Malian Xanthomonas oryzae pv. oryzae Strains.Front Microbiol. 2018 Aug 6;9:1657. doi: 10.3389/fmicb.2018.01657. eCollection 2018. Front Microbiol. 2018. PMID: 30127769 Free PMC article.
-
QueTAL: a suite of tools to classify and compare TAL effectors functionally and phylogenetically.Front Plant Sci. 2015 Aug 3;6:545. doi: 10.3389/fpls.2015.00545. eCollection 2015. Front Plant Sci. 2015. PMID: 26284082 Free PMC article.
References
Publication types
MeSH terms
LinkOut - more resources
Full Text Sources
