

Modelling the first dose of measles vaccination: the role of maternal immunity, demographic factors, and delivery systems
- PMID: 20525415
- PMCID: PMC4756473
- DOI: 10.1017/S0950268810001329
Modelling the first dose of measles vaccination: the role of maternal immunity, demographic factors, and delivery systems
Abstract
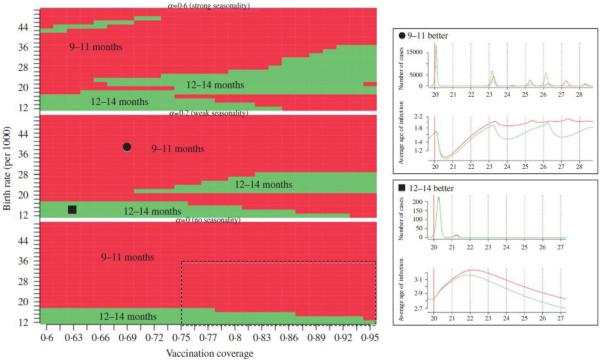
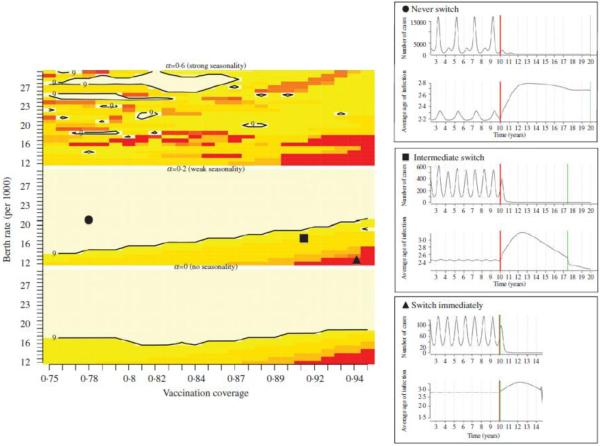
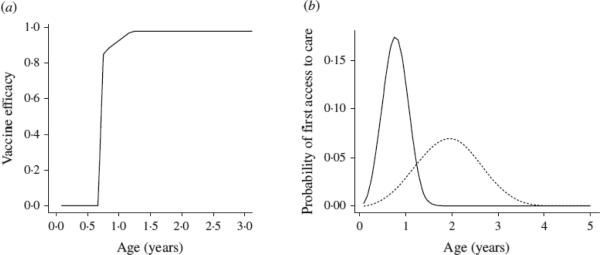
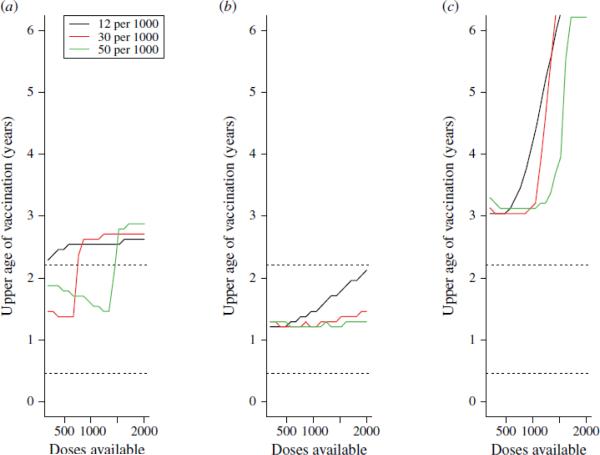
Measles vaccine efficacy is higher at 12 months than 9 months because of maternal immunity, but delaying vaccination exposes the children most vulnerable to measles mortality to infection. We explored how this trade-off changes as a function of regionally varying epidemiological drivers, e.g. demography, transmission seasonality, and vaccination coverage. High birth rates and low coverage both favour early vaccination, and initiating vaccination at 9-11 months, then switching to 12-14 months can reduce case numbers. Overall however, increasing the age-window of vaccination decreases case numbers relative to vaccinating within a narrow age-window (e.g. 9-11 months). The width of the age-window that minimizes mortality varies as a function of birth rate, vaccination coverage and patterns of access to care. Our results suggest that locally age-targeted strategies, at both national and sub-national scales, tuned to local variation in birth rate, seasonality, and access to care may substantially decrease case numbers and fatalities for routine vaccination.
Figures
Similar articles
-
Early two-dose measles vaccination schedule in Guinea-Bissau: good protection and coverage in infancy.Int J Epidemiol. 1999 Apr;28(2):347-52. doi: 10.1093/ije/28.2.347. Int J Epidemiol. 1999. PMID: 10342702 Clinical Trial.
-
Letter to the editor. Spotlight on measles 2010: timely administration of the first dose of measles vaccine in the context of an ongoing measles outbreak in France.Euro Surveill. 2010 Oct 14;15(41):19689; author reply 19686. doi: 10.2807/ese.15.41.19689-en. Euro Surveill. 2010. PMID: 20961512 No abstract available.
-
Is early measles vaccination better than later measles vaccination?Trans R Soc Trop Med Hyg. 2015 Jan;109(1):16-28. doi: 10.1093/trstmh/tru174. Trans R Soc Trop Med Hyg. 2015. PMID: 25573106 Review.
-
Determining infants' age for measles vaccination based on persistence of protective level of maternal measles antibody.Bangladesh Med Res Counc Bull. 2009 Dec;35(3):101-4. doi: 10.3329/bmrcb.v35i3.4204. Bangladesh Med Res Counc Bull. 2009. PMID: 20922913
-
Passive transmission and persistence of naturally acquired or vaccine-induced maternal antibodies against measles in newborns.Vaccine. 2007 Aug 21;25(34):6296-304. doi: 10.1016/j.vaccine.2007.06.020. Epub 2007 Jun 29. Vaccine. 2007. PMID: 17629601 Review.
Cited by
-
Benefits and Challenges in Using Seroprevalence Data to Inform Models for Measles and Rubella Elimination.J Infect Dis. 2018 Jul 2;218(3):355-364. doi: 10.1093/infdis/jiy137. J Infect Dis. 2018. PMID: 29562334 Free PMC article.
-
Characteristics of measles epidemics in China (1951-2004) and implications for elimination: A case study of three key locations.PLoS Comput Biol. 2019 Feb 4;15(2):e1006806. doi: 10.1371/journal.pcbi.1006806. eCollection 2019 Feb. PLoS Comput Biol. 2019. PMID: 30716080 Free PMC article.
-
The Importance of Prioritizing Pre and Posttransplant Immunizations in an Era of Vaccine Refusal and Epidemic Outbreaks.Transplantation. 2020 Jan;104(1):33-38. doi: 10.1097/TP.0000000000002936. Transplantation. 2020. PMID: 31876696 Free PMC article. Review.
-
Effect of evidence updates on key determinants of measles vaccination impact: a DynaMICE modelling study in ten high-burden countries.BMC Med. 2021 Nov 17;19(1):281. doi: 10.1186/s12916-021-02157-4. BMC Med. 2021. PMID: 34784922 Free PMC article.
-
Invalid measles vaccine dose administration and vaccine effectiveness in Ethiopia.Pan Afr Med J. 2021 Dec 16;40:229. doi: 10.11604/pamj.2021.40.229.29028. eCollection 2021. Pan Afr Med J. 2021. PMID: 35145591 Free PMC article.
References
-
- Gans HA, et al. Deficiency of the humoral immune response to measles vaccine in infants immunized at age 6 months. Journal of the American Medical Association. 1998;280:527–532. - PubMed
-
- Redd SC, et al. Comparison of vaccination with measles-mumps rubella vaccine at 9, 12 and 15 months of age. Journal of Infectious Diseases. 2004;189:SI16–122. - PubMed
-
- Halsey NA, et al. Response to measles vaccine in Haitian infants 6 to 12 months old. Influence of maternal antibodies, malnutrition, and concurrent illness. New England Journal of Medicine. 1985;313:544–549. - PubMed
-
- Ceyhan M, et al. Immunogenicity and efficacy of one dose measles-mumps-rubella (MMR) vaccine at twelve months as compared to monovalent measles vaccination of children at nine months followed by MMR revaccination at fifteen months of age. Vaccine. 2001;19:4473–4478. - PubMed
-
- Marks JS, Halpin TJ, Orenstein WA. Measles vaccine efficacy in children previously vaccinated at 12 months of age. Pediatrics. 1978;62:955–960. - PubMed
Publication types
MeSH terms
Substances
Grants and funding
LinkOut - more resources
Full Text Sources
Medical
