. 2009 Feb;58(1):35-54.
doi: 10.1093/sysbio/syp008. Epub 2009 Jun 4.

Properties of consensus methods for inferring species trees from gene trees

Affiliations

Properties of consensus methods for inferring species trees from gene trees

James H Degnan et al. Syst Biol. 2009 Feb.

Abstract

Consensus methods provide a useful strategy for summarizing information from a collection of gene trees. An important application of consensus methods is to combine gene trees to estimate a species tree. To investigate the theoretical properties of consensus trees that would be obtained from large numbers of loci evolving according to a basic evolutionary model, we construct consensus trees from rooted gene trees that occur in proportion to gene-tree probabilities derived from coalescent theory. We consider majority-rule, rooted triple (R(*)), and greedy consensus trees obtained from known, rooted gene trees, both in the asymptotic case as numbers of gene trees approach infinity and for finite numbers of genes. Our results show that for some combinations of species-tree branch lengths, increasing the number of independent loci can make the rooted majority-rule consensus tree more likely to be at least partially unresolved. However, the probability that the R(*) consensus tree has the species-tree topology approaches 1 as the number of gene trees approaches infinity. Although the greedy consensus algorithm can be the quickest to converge on the correct species-tree topology when increasing the number of gene trees, it can also be positively misleading. The majority-rule consensus tree is not a misleading estimator of the species-tree topology, and the R(*) consensus tree is a statistically consistent estimator of the species-tree topology. Our results therefore suggest a method for using multiple loci to infer the species-tree topology, even when it is discordant with the most likely gene tree.


Figures

F<sc>IGURE</sc> 1.
FIGURE 1.
Four-taxon species trees with internal branch lengths x and y, measured in coalescent units.
F<sc>IGURE</sc> 2.
FIGURE 2.
Unresolved zones for 4-taxon species trees. The shaded regions are different areas of the unresolved zones leading to different unresolved majority-rule consensus trees. Shaded regions represent values of x and y for which one of the inequalities (1–4) is violated. (a) The species tree is (((AB)C)D). A star tree is the limiting consensus tree for the red region, where conditions (1) and (2) both fail. The orange region corresponds to the tree with the {ABC} clade unresolved, which is where condition (1) fails. In the tan area to the left of the steeper of the 2 curves, inequality (2) is violated. For comparison, the anomaly zone is also plotted as the area under the heavy, dark curve. The anomaly zone cuts across 2 regions of the unresolved zone, and the area under the line starting from (x, y) = (0, 0.154) which creates the approximately triangular region is the part of the anomaly zone with 3 anomalous gene trees. (b) The species tree is ((AB)(CD)). The unresolved zone in this case is similar in size to that of (a), but there is no anomaly zone for this species tree.
F<sc>IGURE</sc> 3.
FIGURE 3.
The too-greedy zone. The upper curve is the boundary of the anomaly zone for the species tree (((AB)C)D). For points below this curve, there is either one anomalous gene tree (AGT) or 3 AGTs. The 2 blue regions to the left of the curve that extends from roughly (x, y) = (0.067, 0.0) to (0.0078, 2.0) constitute the too-greedy zone, where the GACT is ((AB)(CD)).
F<sc>IGURE</sc> 4.
FIGURE 4.
Species tree ((AB)C)—Probabilities of consensus trees from finite numbers of known gene trees. Each plot shows the probability that each of the 3 consensus methods will return either the species-tree topology ((AB)C) or a star tree (R* and majority rule only). The legend in (a) also applies to each of the 3 plots.
F<sc>IGURE</sc> 5.
FIGURE 5.
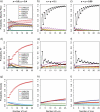
Species tree (((AB)C)D)—Probabilities of consensus trees from finite numbers of known gene trees. One consensus algorithm is used for each row of plots, and one set of branch lengths is used for each column. For the majority-rule and R* algorithms, there are 26 possible 4-taxon consensus trees, including 15 fully resolved trees and 11 trees not fully resolved. The graphs only show some of the more frequently occurring consensus trees; consequently probabilities do not sum to 1. The legends in the left-hand column apply to the 3 plots in their corresponding rows.
F<sc>IGURE</sc> 6.
FIGURE 6.
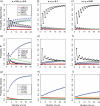
Species tree ((AB)(CD))—Probabilities of consensus trees from finite numbers of known gene trees. One consensus algorithm is used for each row of plots, and one set of branch lengths is used for each column. For the majority-rule and R* algorithms, there are 26 possible 4-taxon consensus trees, including 15 fully resolved trees and 11 trees not fully resolved. The graphs only show some of the more frequently occurring consensus trees; consequently probabilities do not sum to 1. The legends in the left-hand column apply to the 3 plots in their corresponding rows.
F<sc>IGURE</sc> B1.
FIGURE B1.
Reduction of topologies used in the proof of Lemma 9. If 2 trees are connected by an edge, then the topology with the smaller number of leaves is a left subtree of the larger tree.
F<sc>IGURE</sc> B2.
FIGURE B2.
Reduction of the remaining trees from Figure B1 to the 4-taxon asymmetric case, for the proof of Lemma 9. Branches in orange are made long enough that all lineages on these branches coalesce with probability arbitrarily close to 1.

Similar articles

Cited by

References

    1. Ané C, Larget B, Baum DA, Smith SD, Rokas A. Bayesian estimation of concordance among gene trees. Mol. Biol. Evol. 2007;24:412–426. - PubMed
    1. Baum BR. Combining trees as a way of combining data sets for phylogenetic inference, and the desirability of combining trees. Taxon. 1992;41:3–10.
    1. Baum DA. Concordance trees, concordance factors, and the exploration of reticulate genealogy. Taxon. 2007;56:417–426.
    1. Bremer K. Combinable component consensus. Cladistics. 1990;6:369–372. - PubMed
    1. Bryant D. A classification of consensus methods for phylogenies. In: Janowitz M, Lapointe F-J, McMorris FR, Mirkin B, Roberts FS, editors. BioConsensus. Providence (RI): Center for Discrete Mathematics and Theoretical Computer Science, American Mathematical Society; 2003. pp. 163–183.

Publication types