

Phylogenetic tree reconstruction accuracy and model fit when proportions of variable sites change across the tree
- PMID: 20525636
- PMCID: PMC2850392
- DOI: 10.1093/sysbio/syq003
Phylogenetic tree reconstruction accuracy and model fit when proportions of variable sites change across the tree
Abstract
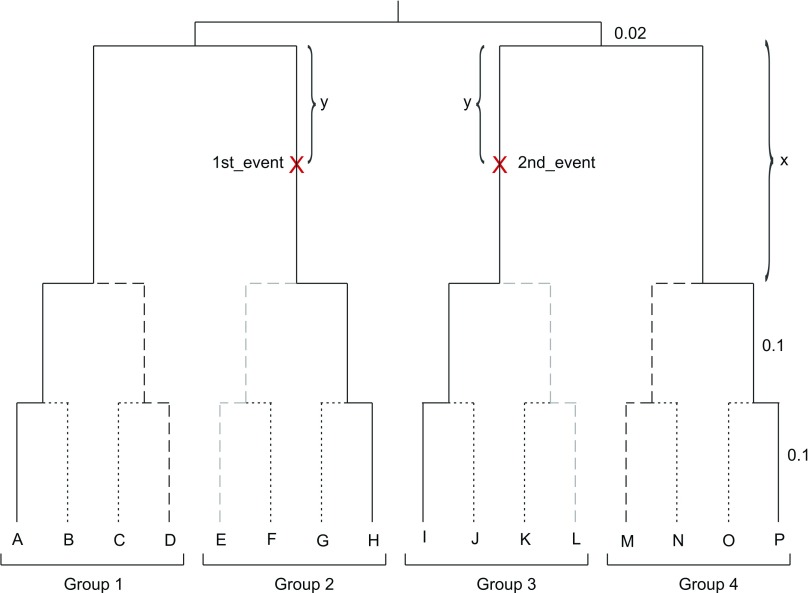
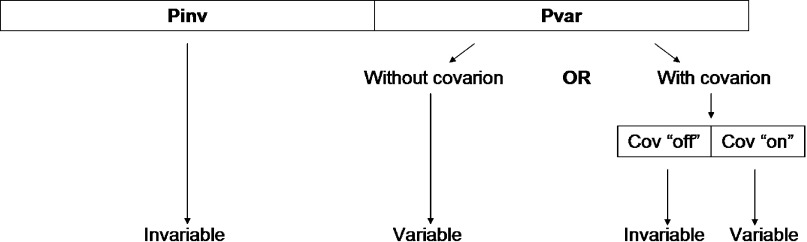
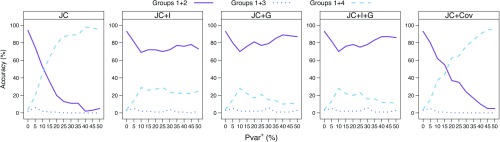
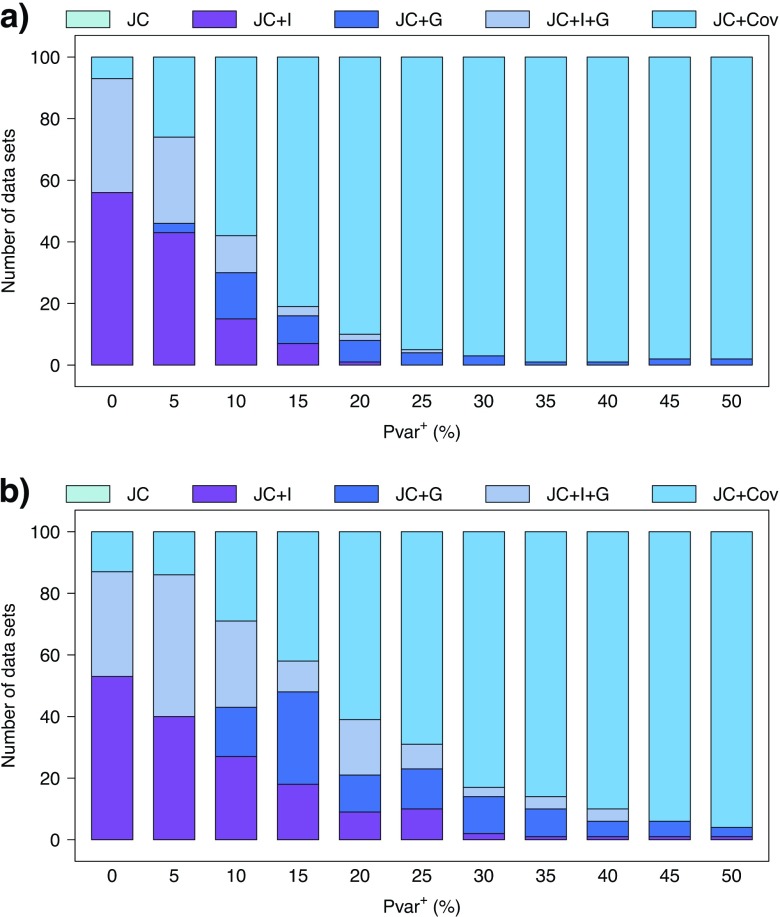
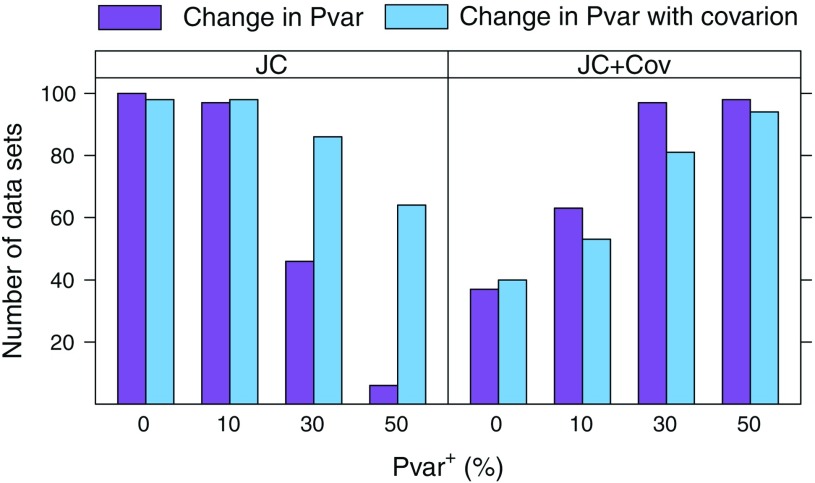
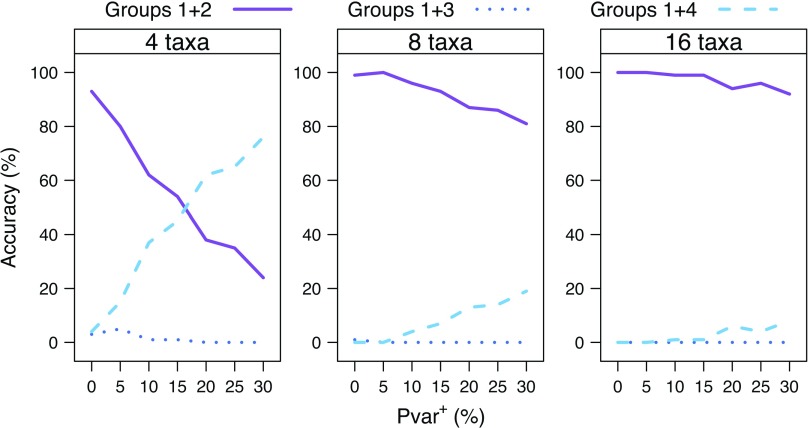
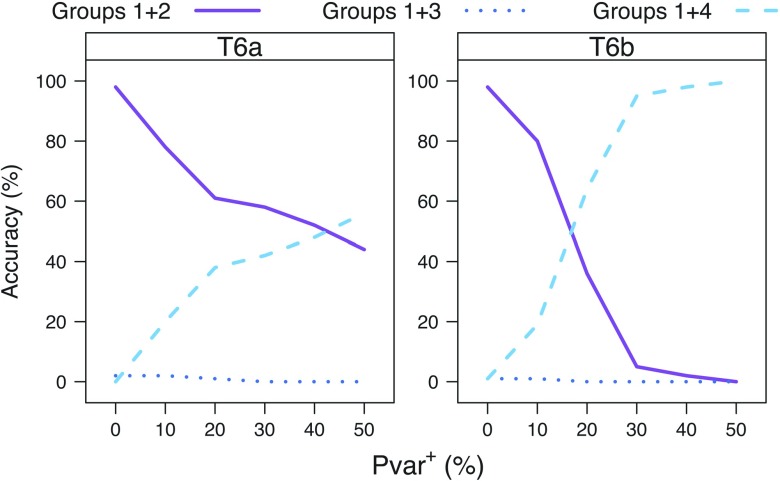
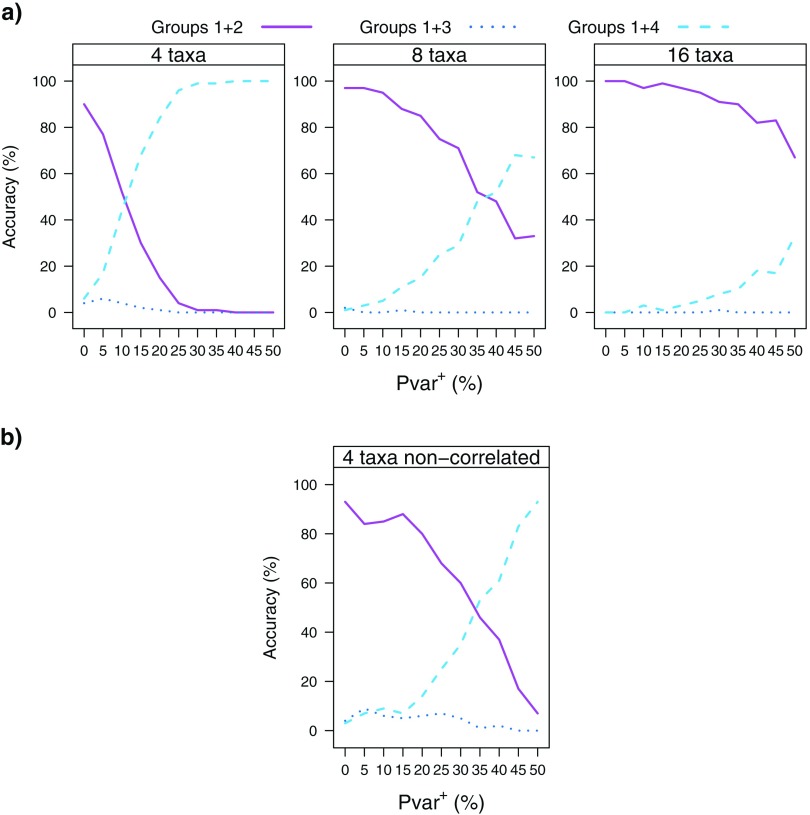
Commonly used phylogenetic models assume a homogeneous process through time in all parts of the tree. However, it is known that these models can be too simplistic as they do not account for nonhomogeneous lineage-specific properties. In particular, it is now widely recognized that as constraints on sequences evolve, the proportion and positions of variable sites can vary between lineages causing heterotachy. The extent to which this model misspecification affects tree reconstruction is still unknown. Here, we evaluate the effect of changes in the proportions and positions of variable sites on model fit and tree estimation. We consider 5 current models of nucleotide sequence evolution in a Bayesian Markov chain Monte Carlo framework as well as maximum parsimony (MP). We show that for a tree with 4 lineages where 2 nonsister taxa undergo a change in the proportion of variable sites tree reconstruction under the best-fitting model, which is chosen using a relative test, often results in the wrong tree. In this case, we found that an absolute test of model fit is a better predictor of tree estimation accuracy. We also found further evidence that MP is not immune to heterotachy. In addition, we show that increased sampling of taxa that have undergone a change in proportion and positions of variable sites is critical for accurate tree reconstruction.
Figures
Similar articles
-
Modelling heterotachy in phylogenetic inference by reversible-jump Markov chain Monte Carlo.Philos Trans R Soc Lond B Biol Sci. 2008 Dec 27;363(1512):3955-64. doi: 10.1098/rstb.2008.0178. Philos Trans R Soc Lond B Biol Sci. 2008. PMID: 18852097 Free PMC article.
-
Modeling compositional heterogeneity.Syst Biol. 2004 Jun;53(3):485-95. doi: 10.1080/10635150490445779. Syst Biol. 2004. PMID: 15503675
-
LineageSpecificSeqgen: generating sequence data with lineage-specific variation in the proportion of variable sites.BMC Evol Biol. 2008 Nov 21;8:317. doi: 10.1186/1471-2148-8-317. BMC Evol Biol. 2008. PMID: 19021917 Free PMC article.
-
Bayesian coestimation of phylogeny and sequence alignment.BMC Bioinformatics. 2005 Apr 1;6:83. doi: 10.1186/1471-2105-6-83. BMC Bioinformatics. 2005. PMID: 15804354 Free PMC article.
-
Probabilistic models of eukaryotic evolution: time for integration.Philos Trans R Soc Lond B Biol Sci. 2015 Sep 26;370(1678):20140338. doi: 10.1098/rstb.2014.0338. Philos Trans R Soc Lond B Biol Sci. 2015. PMID: 26323768 Free PMC article. Review.
Cited by
-
An Analysis of Methylome Evolution in Primates.Mol Biol Evol. 2021 Oct 27;38(11):4700-4714. doi: 10.1093/molbev/msab189. Mol Biol Evol. 2021. PMID: 34175932 Free PMC article.
-
Evaluating the Evolutionary Origins of Unexpected Character Distributions within the Bacterial Planctomycetes-Verrucomicrobia-Chlamydiae Superphylum.Front Microbiol. 2012 Nov 23;3:401. doi: 10.3389/fmicb.2012.00401. eCollection 2012. Front Microbiol. 2012. PMID: 23189077 Free PMC article.
-
A Novel Test for Absolute Fit of Evolutionary Models Provides a Means to Correctly Identify the Substitution Model and the Model Tree.Genome Biol Evol. 2019 Aug 1;11(8):2403-2419. doi: 10.1093/gbe/evz167. Genome Biol Evol. 2019. PMID: 31368483 Free PMC article.
-
Comparing Partitioned Models to Mixture Models: Do Information Criteria Apply?Syst Biol. 2022 Oct 12;71(6):1541-1548. doi: 10.1093/sysbio/syac003. Syst Biol. 2022. PMID: 35041002 Free PMC article.
-
Genome-wide mapping using new AFLP markers to explore intraspecific variation among pathogenic Sporothrix species.PLoS Negl Trop Dis. 2020 Jul 1;14(7):e0008330. doi: 10.1371/journal.pntd.0008330. eCollection 2020 Jul. PLoS Negl Trop Dis. 2020. PMID: 32609739 Free PMC article.
References
-
- Akaike H. A new look at the statistical model identification. IEEE Trans. Automat. Contr. 1974;19:716–723.
-
- Ane C, Burleigh JG, McMahon MM, Sanderson MJ. Covarion structure in plastid genome evolution: a new statistical test. Mol. Biol. Evol. 2005;22:914–924. - PubMed
-
- Bollback JP. Bayesian model adequacy and choice in phylogenetics. Mol. Biol. Evol. 2002;19:1171–1180. - PubMed
-
- Fitch WM, Markowitz E. An improved method for determining codon variability in a gene and its application to rate of fixation of mutations in evolution. Biochem. Genet. 1970;4:579–593. - PubMed
-
- Gadagkar SR, Kumar S. Maximum likelihood outperforms maximum parsimony even when evolutionary rates are heterotachous. Mol. Biol. Evol. 2005;22:2139–2141. - PubMed
