. 2010 Sep 17;285(38):29336-47.
doi: 10.1074/jbc.M110.101147. Epub 2010 Jun 3.

Mechanical stretch up-regulates microRNA-26a and induces human airway smooth muscle hypertrophy by suppressing glycogen synthase kinase-3β

Affiliations

Mechanical stretch up-regulates microRNA-26a and induces human airway smooth muscle hypertrophy by suppressing glycogen synthase kinase-3β

Junaith S Mohamed et al. J Biol Chem. .

Abstract

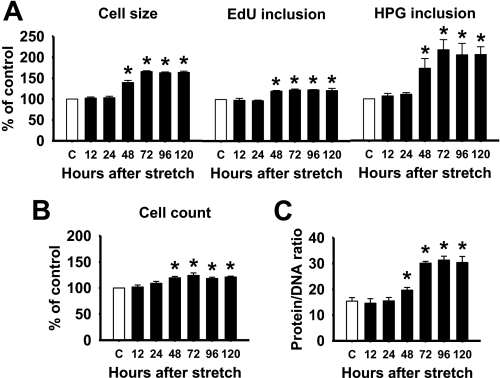
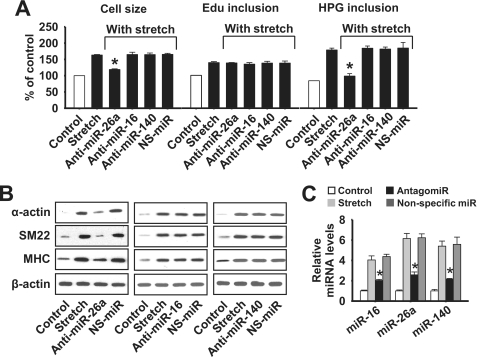
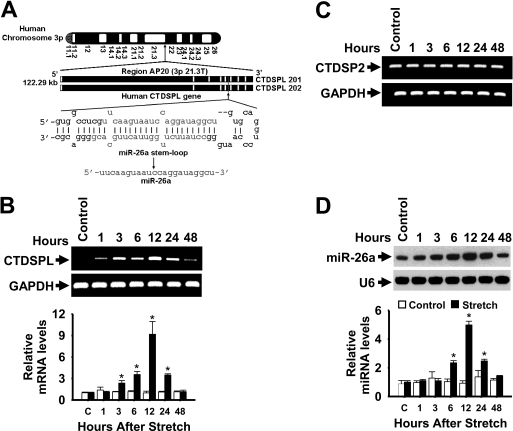
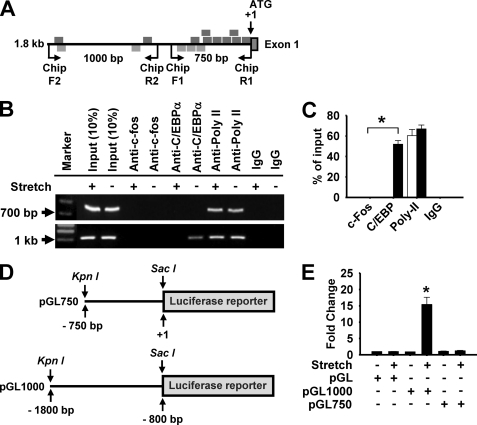
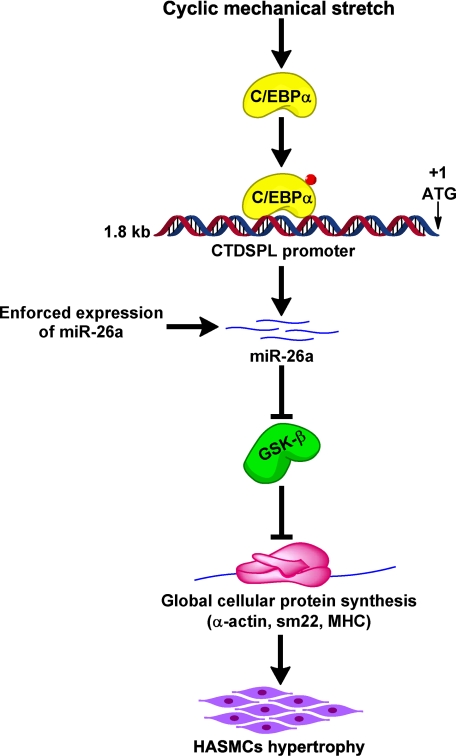
Airway smooth muscle hypertrophy is one of the hallmarks of airway remodeling in severe asthma. Several human diseases have been now associated with dysregulated microRNA (miRNA) expression. miRNAs are a class of small non-coding RNAs, which negatively regulate gene expression at the post-transcriptional level. Here, we identify miR-26a as a hypertrophic miRNA of human airway smooth muscle cells (HASMCs). We show that stretch selectively induces the transcription of miR-26a located in the locus 3p21.3 of human chromosome 3. The transcription factor CCAAT enhancer-binding protein α (C/EBPα) directly activates miR-26a expression through the transcriptional machinery upon stretch. Furthermore, stretch or enforced expression of miR-26a induces HASMC hypertrophy, and miR-26 knockdown reverses this effect, suggesting that miR-26a is a hypertrophic gene. We identify glycogen synthase kinase-3β (GSK-3β), an anti-hypertrophic protein, as a target gene of miR-26a. Luciferase reporter assays demonstrate that miR-26a directly interact with the 3'-untranslated repeat of the GSK-3β mRNA. Stretch or enforced expression of miR-26a attenuates the endogenous GSK-3β protein levels followed by the induction of HASMC hypertrophy. miR-26 knockdown reverses this effect, suggesting that miR-26a-induced hypertrophy occurs via its target gene GSK-3β. Overall, as a first time, our study unveils that miR-26a is a mechanosensitive gene, and it plays an important role in the regulation of HASMC hypertrophy.


Figures

FIGURE 1.
FIGURE 1.
Stretch alters micro-RNAs expression in HASMCs. A, HASMCs were stimulated with stretch for 1 h. Total RNA was isolated after 12 h and used to conduct a microarray analysis to determine the expression levels of human miRNAs. Data are presented on a scatter plot showing log 10-transformed signal intensities for each probe on both channels for the Cy3-labeled controls (no stretch) and Cy5-labeled stretch stimulated samples. Each dot represents one miRNA probe. B and C, RNA used in A was analyzed by solution hybridization technique with 5′-biotin-labeled miR-16, miR-26a, and miR-140 and small nuclear RNA U6 (B) and, in a separate experiment, by qPCR to assay the expression of miR-16, miR-26a, miR-140, and U6 under the same conditions (C). U6 served as both loading control and normalizer. *, p < 0.05 versus corresponding control without stretch (white bar). Gel pictures are representative of three separate experiments. Each bar indicates mean ± S.E. (n = 3).
FIGURE 2.
FIGURE 2.
Stretch induces HASMC hypertrophy and hyperplasia. HASMCs were stimulated with a 1-h stretch for every 12-h period, and then cell size, DNA synthesis, protein synthesis (A), protein/DNA ratio (B), and cell count (C) were analyzed for the indicated periods. *, p < 0.05 versus control without stretch (white bar) for the indicated time point. Each bar indicates mean ± S.E. (n = 3).
FIGURE 3.
FIGURE 3.
Stretch-induced miR-26a is involved in initiating hypertrophy. HASMCs were transfected with anti-miR-26a, anti-miR-16, anti-miR-140, or nonspecific miRNA (NS-miR). Twenty-four hours after transfection cells were stimulated with a 1-h stretch for every 12 h. A, cell size, DNA synthesis, and protein synthesis were analyzed after 72 h. B, a portion of cells used in A was analyzed to show contractile proteins such as α-actin, smooth muscle 22 (SM22), and myosin heavy chain (MHC) expressions by Western blot. C, cells were transfected with anti-miR-26a, anti-miR-16, anti-miR-140, or NS-miR for 24 h followed by a 1-h stretch. Total RNA was isolated after 36 h, and the levels of miRNAs were quantified by RT-qPCR. Gel pictures are representative of three separate experiments. *, p < 0.05 versus stretch. Each bar indicates mean ± S.E. (n = 3).
FIGURE 4.
FIGURE 4.
Enforced expression of miR-26a induces hypertrophy. A, structure of pSilencer-miR-26a construct contains pre-miR-26a, cytomegalovirus promoter (CMV), simian virus 40 (SV40), and neomycin. The blue letters represent two restriction sites BamHI and HindIII. The red letters indicate 22 bases of mature miR-26a sequence. The underlined letters represent 77-bp stem-loop sequence, and the green letters indicate 100-bp native flank sequence to both upstream and downstream of the stem-loop sequence. B–E, cells were transfected with pSilencer or pSilencer-miR-26a and/or anti-miR-26a for 24 h followed by a 1-h stretch for every 12 h. B, 36 h after transfection, the overexpression of pre-miR-26a and mature miR-26a was confirmed by RT-qPCR (upper panel) and solution hybridization methods (lower panel), respectively. Cell size, DNA synthesis, protein synthesis, and cell count (C), and α-actin, SM22, and MHC expressions (D) were analyzed 72 h after transfection. Protein/DNA ratio (E) was also analyzed. β-Actin served as a loading control. Gel pictures are representative of three separate experiments. δ, p < 0.05 versus control and *, p < 0.05 versus pSilencer-miR-26a. Each bar indicates mean ± S.E. (n = 3).
FIGURE 5.
FIGURE 5.
GSK-3β is a target of miR-26a. A, sequence alignment of putative miR-26a targeting site in 3′UTR of GSK-3β shows a high level of complementarily and sequence conservation. B, HASMCs were stimulated with a 1-h stretch. Total and phosphorylated (p) GSK-3β protein levels were analyzed by Western blot for the indicated periods. C, HASMCs were transfected with pSilencer or pSilencer-miR-26a expression construct. GSK-3β mRNA levels were analyzed 24 h after transfection by RT-qPCR (left panel), and total GSK-3β protein levels were analyzed 48 h after transfection by Western blot (right panel). D, cells were transfected with pcDNA-GSK-3β construct, and overexpressions of GSK-3β mRNA (after 36 h) and protein (after 48 h) were confirmed by RT-PCR (upper panel) and Western blot (lower panel) methods, respectively. E, cells were transfected with pcDNA-GSK-3β construct, along with indicated amount of pSilencer-miR-26a construct. GSK-3β protein expression was analyzed by Western blot 48 h after transfection. Gel pictures are representative of three separate experiments. Each bar indicates mean ± S.E. (n = 3).
FIGURE 6.
FIGURE 6.
miR-26a directly binds on the 3′UTR of the GSK-3β mRNA. A, HASMCs were transfected with the GSK-3β-3′UTR-luciferase construct, along with pSilencer-miR-26a construct. Forty-eight hours after transfection, cells were collected and then firefly luciferase activities were estimated and normalized to Renilla luciferase activities. *, p < 0.05 versus GSK-3β-3′UTR-luciferase construct alone. B, cells were transfected with pcDNA or pcDNA-GSK-3β without 3′ UTR. Forty-eight hours after transfection, cells were collected for the analysis of GSK-3β mRNA and protein expressions by RT-PCR (upper panel) and Western blot (lower panel) methods, respectively. C, cells were co-transfected with pcDNA or pcDNA-GSK-3β without 3′ UTR and/or pSilencer-miR-26a. Forty-eight hours after transfection, cells were collected for the analysis of GSK-3β protein expression by Western blot method. D, cells were transfected with pcDNA or pcDNA-GSK-3β construct (with 3′UTR), and cell size and protein synthesis were determined 72 h after transfection. *, p < 0.05 versus miR-26a alone. E, a portion of cells used in C was stimulated with a 1-h stretch every 12 h. Cell size and protein synthesis were measured 72 h after transfection. Gel pictures are representative of three separate experiments. Each bar indicates mean ± S.E. (n = 3).
FIGURE 7.
FIGURE 7.
Kinetics of stretch induction of CTDSPL mRNA and mature miR-26a. A, depiction of the genomic structure of the human CTDSPL coding RNA genes in chromosome 3p and location of miR-26a in introns 5 (CTDSPL 201) and 4 (CTDSPL 202). B and D, HASMCs were stimulated with a 1-h stretch, and total RNA was isolated over a 48-h period. The levels of CTDSPL (B) and CTDSP2 (C) mRNAs were analyzed by RT-qPCR (data for CTDSPL mRNA levels by qPCR are not shown) and resolved in 2% agarose gel electrophoresis. Primers were designed to target CTDSPL (identical for CTDSPL 201 and 202) and CTDSP2 sequences extending outside of miR-26a. GAPDH served as both loading control and normalizer. The levels of CTDSPL were presented relatively to that of GAPDH level. *, p < 0.05 versus corresponding control without stretch for the indicated time points. RNA used in the above experiments was also analyzed by solution hybridization technique with 5′-biotin-labeled miR-26a and small nuclear RNA U6 and in a separate experiment by RT-qPCR to assay expression of miR-26a and U6 under the same conditions (D). U6 served as both loading control and normalizer. *, p < 0.05 versus corresponding control without stretch for the indicated time points. Gel pictures are representative of three separate experiments. Each bar indicates mean ± S.E. (n = 3).
FIGURE 8.
FIGURE 8.
miR-26a is a C/EBPα-dependent gene. A, schematic representation of the 5′UTR of the human CTDSPL gene (miR-26a promoter). Region between −1800 and +1 bp contains putative binding elements for AP-1 (bottom) and C/EBPα (top). B and C, HASMCs were stimulated with a 1-h stretch, and then the chromatin was isolated and precipitated with anti-c-Fos, anti-C/EBPα, anti-RNA Poly II, or nonspecific IgG. qPCRs were performed with two sets of primers, as shown in A, specific for miR-26a promoter to identify the specific transcription factor and its region of binding to the miR-26a promoter (B) and resolved in 1% agarose gel (C). D and E, a 750-bp (pGL750) and 1000-bp (pGL1000) promoter region was synthesized and linked to luciferase (Luc) reporter gene (D). Cells were transfected with empty vector or the pGL750 or pGL1000 miR-26a promoter region. Forty-eight hours after transfection, cells were stimulated with a 1-h stretch, and then firefly luciferase activities were estimated and normalized to Renilla luciferase activities (E). *, p < 0.05 versus pGL alone. Gel pictures are representative of three separate experiments. Each bar indicates mean ± S.E. (n = 3).
FIGURE 9.
FIGURE 9.
Knockdown of endogenous C/EBPα expression reduces miR-26a promoter activity. A, HASMCs were transfected with C/EBPα RNAi or its scramble form (SC-C/EBPα RNAi). Forty-eight hours after transfection, total and phosphorylated (p) C/EBPα levels were detected by Western blots. B, in a separate experiment, forty-eight hours after RNAi transfection, cells were transfected with the empty vector (pGL) or the constructs of the pGL1000 vector. Forty-eight hours after transfection, cells were stimulated with a 1-h stretch, and then firefly luciferase activities were estimated and normalized to Renilla luciferase activities. C, cells were transfected as shown in A. Twenty-four hours after transfection, cells were stimulated with a 1-h stretch for every 12 h. Cell size and protein synthesis were measured 72 h after transfection. *, p < 0.05 versus stretch alone. Gel pictures are representative of three separate experiments. Each bar indicates mean ± S.E. (n = 3).
FIGURE 10.
FIGURE 10.
miR-26a pathway in the initiation of HASMC hypertrophy. Up-regulation of miR-26a by stretching of HASMCs or enforced expression of mir-26a suppresses GSK-3β protein expression that triggers global cellular protein synthesis. As a result, smooth muscle hypertrophic marker proteins (α-actin, SM22, and MHC) are up-regulated, which, in turn, initiates hypertrophy.

Similar articles

Cited by

References

    1. Cai X., Hagedorn C. H., Cullen B. R. (2004) RNA 10, 1957–1966 - PMC - PubMed
    1. Lee Y., Kim M., Han J., Yeom K. H., Lee S., Baek S. H., Kim V. N. (2004) EMBO J. 23, 4051–4060 - PMC - PubMed
    1. Rodriguez A., Griffiths-Jones S., Ashurst J. L., Bradley A. (2004) Genome Res. 14, 1902–1910 - PMC - PubMed
    1. Bartel D. P. (2004) Cell 116, 281–297 - PubMed
    1. Lin S. L., Miller J. D., Ying S. Y. (2006) J. Biomed. Biotechnol. 4, 1–13 - PMC - PubMed

Publication types

MeSH terms