. 2010 Aug 6;285(32):24676-85.
doi: 10.1074/jbc.M110.106278. Epub 2010 Jun 4.

PKA regulates vacuolar H+-ATPase localization and activity via direct phosphorylation of the a subunit in kidney cells

Affiliations

PKA regulates vacuolar H+-ATPase localization and activity via direct phosphorylation of the a subunit in kidney cells

Rodrigo Alzamora et al. J Biol Chem. .

Abstract

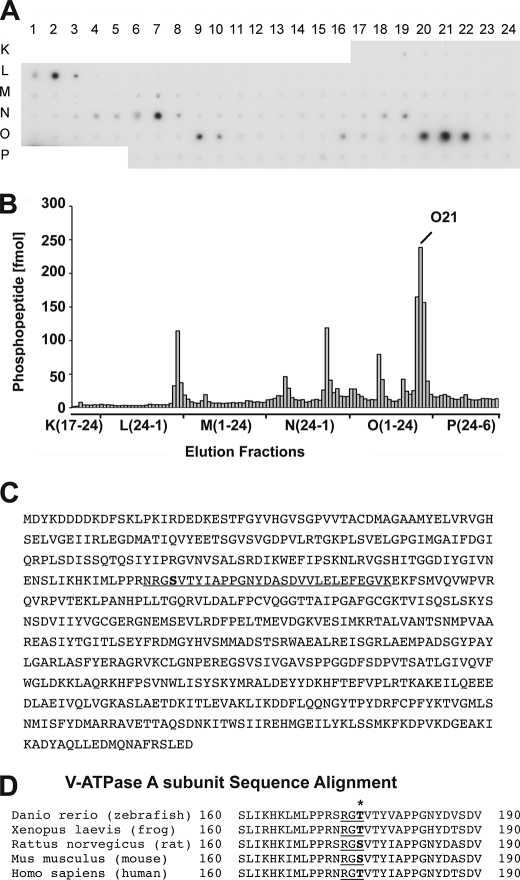
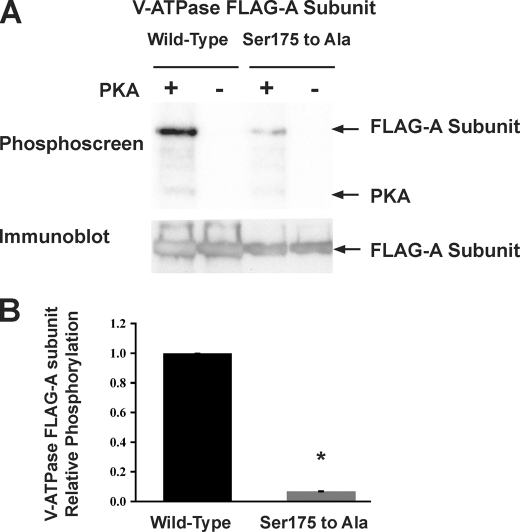
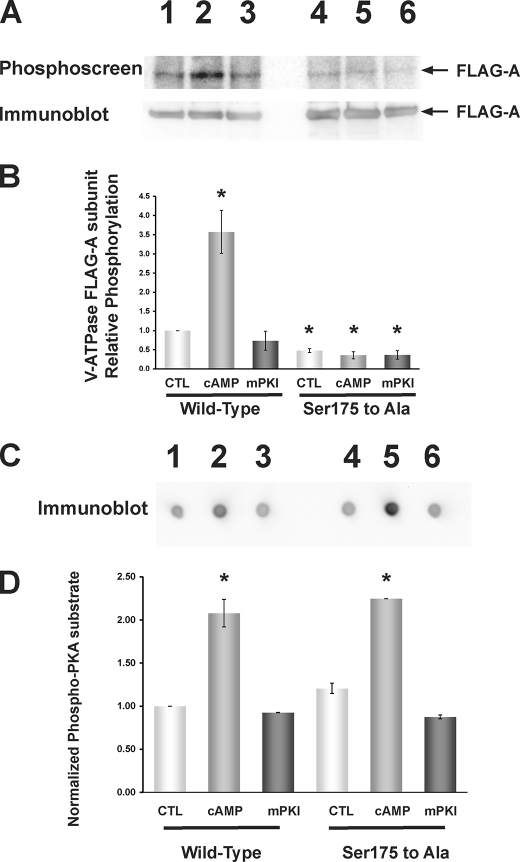
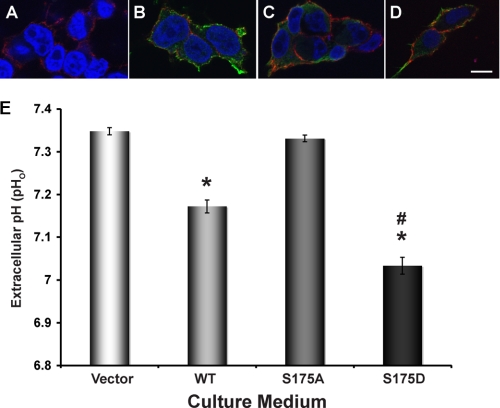
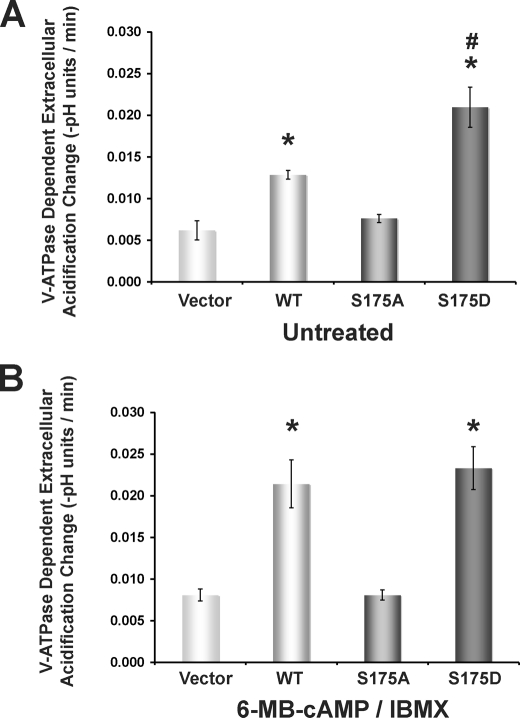
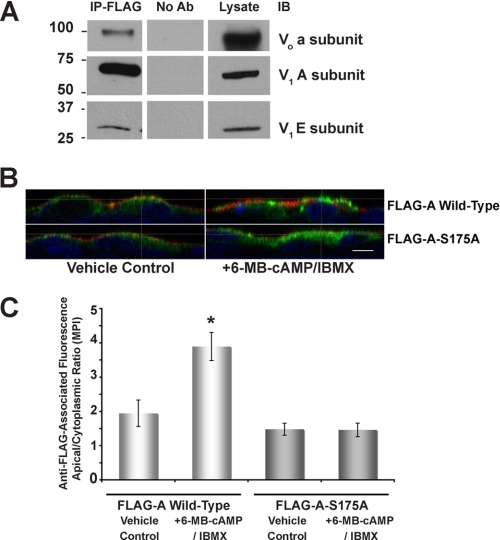
The vacuolar H(+)-ATPase (V-ATPase) is a major contributor to luminal acidification in epithelia of Wolffian duct origin. In both kidney-intercalated cells and epididymal clear cells, cAMP induces V-ATPase apical membrane accumulation, which is linked to proton secretion. We have shown previously that the A subunit in the cytoplasmic V(1) sector of the V-ATPase is phosphorylated by protein kinase A (PKA). Here we have identified by mass spectrometry and mutagenesis that Ser-175 is the major PKA phosphorylation site in the A subunit. Overexpression in HEK-293T cells of either a wild-type (WT) or phosphomimic Ser-175 to Asp (S175D) A subunit mutant caused increased acidification of HCO(3)(-)-containing culture medium compared with cells expressing vector alone or a PKA phosphorylation-deficient Ser-175 to Ala (S175A) mutant. Moreover, localization of the S175A A subunit mutant expressed in HEK-293T cells was more diffusely cytosolic than that of WT or S175D A subunit. Acute V-ATPase-mediated, bafilomycin-sensitive H(+) secretion was up-regulated by a specific PKA activator in HEK-293T cells expressing WT A subunit in HCO(3)(-)-free buffer. In cells expressing the S175D mutant, V-ATPase activity at the membrane was constitutively up-regulated and unresponsive to PKA activators, whereas cells expressing the S175A mutant had decreased V-ATPase activity that was unresponsive to PKA activation. Finally, Ser-175 was necessary for PKA-stimulated apical accumulation of the V-ATPase in a polarized rabbit cell line of collecting duct A-type intercalated cell characteristics (Clone C). In summary, these results indicate a novel mechanism for the regulation of V-ATPase localization and activity in kidney cells via direct PKA-dependent phosphorylation of the A subunit at Ser-175.


Figures

FIGURE 1.
FIGURE 1.
Identification of Ser-175 as a major site for PKA phosphorylation in the V-ATPase A subunit. FLAG-A V-ATPase subunit expressed in HEK-293T cells was incubated with a substoichiometric amount of PKA in the presence of [γ-32P]ATP, the proteins were subjected to SDS-PAGE, and the band corresponding to FLAG-A V-ATPase A-subunit was excised. A, autoradiographic film showing the fractionation profile of phosphopeptide mixtures after in-gel digestion and microfractionation onto prespotted AnchorChips. B, analysis by densitometry of individual radioactive spots identified after the microfractionation (shown in A) and quantification of the phosphorylated peptides using appropriate standards. The major radioactive peak eluted in fraction E10 and the corresponding phosphorylated peptide was identified by mass spectrometry. C, mouse FLAG-tagged V-ATPase A subunit amino acid sequence highlighting the major peptide phosphorylated by PKA (O21 fraction). D, Ser-175 (bold) is part of a highly conserved PKA consensus target phosphorylation site in this peptide.
FIGURE 2.
FIGURE 2.
PKA phosphorylation of the A subunit in vitro occurs at Ser-175. A, typical phosphoscreen image (upper) revealing the signal of PKA in vitro phosphorylated A subunit compared with the Ser-175 to Ala mutant. The immunoblot blot (lower) confirms similar protein expression and loading of the gel for the different conditions. B, quantification of mean (±S.E.) V-ATPase A subunit phosphorylation signal normalized for protein loading as assessed by densitometry of Western blot. Compared with WT FLAG-A subunit, the phosphorylation-deficient (Ser to Ala) mutant showed a significant 90–95% decrease in phosphorylation by PKA in vitro (*, p < 0.05 relative to WT; n = 3).
FIGURE 3.
FIGURE 3.
PKA-dependent in vivo phosphorylation of the V-ATPase A subunit in HEK-293T cells occurs at Ser-175. FLAG-tagged WT or S175A mutant A subunit was transfected into HEK-293T cells 1 day before experimentation, and cells were then incubated with [32P]orthophosphate for 2 h under control conditions or in the presence of PKA activator (1 mm 6-MB-cAMP; last 20 min of labeling period) or PKA inhibitor (10 μm mPKI; for entire labeling period). Cell lysis, immunoprecipitation using an anti-FLAG antibody, SDS-PAGE, immunoblotting using an anti-FLAG antibody, and exposure of the same membrane to a phosphoscreen were then performed as described (38). A, typical phosphoscreen image (upper panel) revealing the signal of phosphorylated A subunit in cells expressing FLAG-A-WT subunit (lanes 1–3) or FLAG-A-S175A subunit (lanes 4–6). Lanes 1 and 4 were derived from control-treated cells, lanes 2 and 5 were derived from PKA-stimulated cells, and lanes 3 and 6 were derived from PKA-inhibited cells. The Western blot (lower panel) confirms similar protein expression and loading of the gel for the different conditions. B, quantification of mean (±S.E.) V-ATPase A subunit phosphorylation signal relative to FLAG-A-WT control condition and normalized for protein expression. PKA activator increased FLAG-A-WT phosphorylation to ∼3.5 times that of the control condition, whereas FLAG-A-S175A mutant subunit phosphorylation was reduced across all conditions to ∼0.5 times that of the FLAG-A-WT subunit under the control condition (*, p < 0.05 relative to WT control by analysis of variance; n = 3 replicate experiments). C, dot blots using the PKA phosphorylation substrate-specific antibody of whole cell lysate samples taken from cells transfected and treated under the same conditions as shown in A and B and spotted onto a nitrocellulose filter. D, quantification of mean (±S.E.) PKA-phosphorylated substrate signal relative to that FLAG-A-WT-transfected cell lysates under the control condition and normalized to β-actin blot signal re-probed on the same dot blot (not shown). PKA activator 6-MB-cAMP increased the PKA-phosphorylated substrate signal to 2–2.5 times that of control (*, p < 0.05, relative to FLAG-A-WT control; unpaired t tests), whereas mPKI had no significant effect. As a further control, we measured the levels of [32P]orthophosphate protein labeling in cellular lysates. We did not observe any statistically significant difference across conditions, independently of the A-subunit mutant expressed and pharmacologic treatments (n = 3 per condition; data not shown).
FIGURE 4.
FIGURE 4.
Expression of WT and mutant V-ATPase A subunit in HEK-293T cells modulates subcellular localization of the A subunit and extracellular pH. HEK-293 cells were transfected with either vector alone (A) or FLAG-tagged WT (B), S175A (C), or S175D (D) mutant A subunit 1 day prior to immunofluorescence staining for expression of FLAG (green), concanavalin A coupled to CY3 as a membrane marker (red), and TO-PRO-3 nuclear stain (blue). Scale bar = 15 μm. E, mean (±S.E.) extracellular pH (pHo) of the culture medium from HEK-293T cells transfected with different plasmids after 28–31 h incubation (*, p < 0.0001 relative to vector alone; #, p < 0.0001 relative to WT; n = 15–18).
FIGURE 5.
FIGURE 5.
Bafilomycin-sensitive, V-ATPase-dependent extracellular acidification is modulated by Ser-175 A subunit mutants and PKA activators in HEK-293T cells. Cells were transfected with vector alone, WT, S175A, or S715D mutant FLAG-tagged A subunit for 28–31 h, and the rate of extracellular acidification in each set of transfected cells was measured in a low buffering capacity solution before and after the addition of bafilomycin A1, a specific V-ATPase inhibitor (see “Experimental Procedures”). The mean (±S.E.) rate of extracellular acidification (−[final buffer pH − initial buffer pH]/Δt) was obtained in the absence or presence of bafilomycin, for cells incubated either with (A) or without (B) PKA activators (n = 6 for each transfection condition; n = 6 for each treatment condition) (*, p < 0.005 relative to vector alone; #, p < 0.02 relative to WT).
FIGURE 6.
FIGURE 6.
The phosphorylation-deficient V-ATPase A subunit Ser-175 to Ala mutant does not accumulate at the apical membrane of intercalated cells in response to PKA activators. The Clone C cell line of intercalated cell characteristics was used for independent transient transfections using either WT or S175A A subunit. A, immunoprecipitation using an anti-FLAG antibody (IP-FLAG; left column) followed by immunoblotting using antibodies against the a (upper), A (middle), or E (lower) V-ATPase subunits revealed that the transfected FLAG-tagged A subunit forms a complex with the native V0 sector a subunit and with the V1 sector E subunit. No co-immunoprecipitation was observed when no antibody was added to the immunoprecipitation reaction (center column). Samples of the whole cell lysate (5%) were also directly immunoblotted for each of the three subunits (right column). B, 1 day after transfection with either FLAG-A wild-type subunit (top panels) or FLAG-A S175A mutant subunit (lower panels), Clone C cells were plated onto Transwell filters. After 4 days the filters were incubated in PBS, pH 7.1, with 100 μm 6-MB-cAMP and 0.5 mm IBMX (right panels) or with PBS, pH 7.1, alone (left panels) for 30 min. These incubations were followed by an incubation with concanavalin A coupled to CY3 (red) for 5 min in PBS, pH 7.1, fixation, and immunofluorescence labeling using anti-FLAG antibody (green) and TO-PRO-3 nuclear stain (blue). Scale bar = 10 μm. C, quantification of V-ATPase-associated mean pixel intensity (MPI) ratio of apical ROI-1 (where the A-subunit co-localizes with concanavalin A) and cytoplasmic ROI-2 (A-subunit alone). This ROI-1/ROI-2 ratio under the different conditions reveals a significant PKA-mediated apical V-ATPase accumulation in cells expressing the WT A subunit compared with cells expressing the S175A mutant (ROI-1/ROI-2 ratio presented as mean (±S.E.); *, p < 0.05 versus V-ATPase A WT; n = 20–45 cells analyzed for both conditions).

References

    1. Nelson N., Harvey W. R. (1999) Physiol. Rev. 79, 361–385 - PubMed
    1. Forgac M. (2007) Nat. Rev. Mol. Cell Biol. 8, 917–929 - PubMed
    1. Zeidel M. L., Silva P., Seifter J. L. (1986) J. Clin. Invest. 77, 113–120 - PMC - PubMed
    1. Gluck S., Al-Awqati Q. (1984) J. Clin. Invest. 73, 1704–1710 - PMC - PubMed
    1. Gluck S., Caldwell J. (1988) Am. J. Physiol. 254, F71–79 - PubMed

Publication types

Substances