Sub-AQUA: real-value quality assessment of protein structure models
- PMID: 20525730
- PMCID: PMC2898499
- DOI: 10.1093/protein/gzq030
Sub-AQUA: real-value quality assessment of protein structure models
Abstract
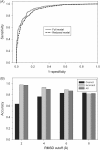
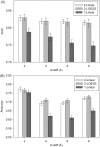
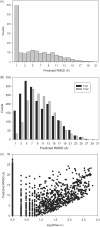
Computational protein tertiary structure prediction has made significant progress over the past years. However, most of the existing structure prediction methods are not equipped with functionality to predict accuracy of constructed models. Knowing the accuracy of a structure model is crucial for its practical use since the accuracy determines potential applications of the model. Here we have developed quality assessment methods, which predict real value of the global and local quality of protein structure models. The global quality of a model is defined as the root mean square deviation (RMSD) and the LGA score to its native structure. The local quality is defined as the distance between the corresponding Calpha positions of a model and its native structure when they are superimposed. Three regression methods are employed to combine different types of quality assessment measures of models, including alignment-level scores, residue-position level scores, atomic-detailed structure level scores and composite scores. The regression models were tested on a large benchmark data set of template-based protein structure models of various qualities. In predicting RMSD and the LGA score, a combination of two terms, length-normalized SPAD, a score that assesses alignment stability by considering suboptimal alignments, and Verify3D normalized by the square of the model length shows a significant performance, achieving 97.1 and 83.6% accuracy in identifying models with an RMSD of <2 and 6 A, respectively. For predicting the local quality of models, we find that a two-step approach, in which the global RMSD predicted in the first step is further combined with the other terms, can dramatically increase the accuracy. Finally, the developed regression equations are applied to assess the quality of structure models of whole E. coli proteome.
Figures


Similar articles
-
Estimating quality of template-based protein models by alignment stability.Proteins. 2008 May 15;71(3):1255-74. doi: 10.1002/prot.21819. Proteins. 2008. PMID: 18041762
-
FragQA: predicting local fragment quality of a sequence-structure alignment.Genome Inform. 2007;19:27-39. Genome Inform. 2007. PMID: 18546502
-
Structure-dependent sequence alignment for remotely related proteins.Bioinformatics. 2002 Dec;18(12):1658-65. doi: 10.1093/bioinformatics/18.12.1658. Bioinformatics. 2002. PMID: 12490451
-
Quality assessment of protein structure models.Curr Protein Pept Sci. 2009 Jun;10(3):216-28. doi: 10.2174/138920309788452173. Curr Protein Pept Sci. 2009. PMID: 19519452 Review.
-
A decade of CASP: progress, bottlenecks and prognosis in protein structure prediction.Curr Opin Struct Biol. 2005 Jun;15(3):285-9. doi: 10.1016/j.sbi.2005.05.011. Curr Opin Struct Biol. 2005. PMID: 15939584 Review.
Cited by
-
Energetics-based discovery of protein-ligand interactions on a proteomic scale.J Mol Biol. 2011 Apr 22;408(1):147-62. doi: 10.1016/j.jmb.2011.02.026. Epub 2011 Feb 19. J Mol Biol. 2011. PMID: 21338610 Free PMC article.
-
Prediction of Local Quality of Protein Structure Models Considering Spatial Neighbors in Graphical Models.Sci Rep. 2017 Jan 11;7:40629. doi: 10.1038/srep40629. Sci Rep. 2017. PMID: 28074879 Free PMC article.
-
Effect of using suboptimal alignments in template-based protein structure prediction.Proteins. 2011 Jan;79(1):315-34. doi: 10.1002/prot.22885. Proteins. 2011. PMID: 21058297 Free PMC article.
-
Virtual screening and repurposing of approved drugs targeting homoserine dehydrogenase from Paracoccidioides brasiliensis.J Mol Model. 2022 Nov 3;28(11):374. doi: 10.1007/s00894-022-05335-0. J Mol Model. 2022. PMID: 36323986
-
Three-Dimensional Molecular Modeling of a Diverse Range of SC Clan Serine Proteases.Mol Biol Int. 2012;2012:580965. doi: 10.1155/2012/580965. Epub 2012 Nov 19. Mol Biol Int. 2012. PMID: 23213528 Free PMC article.
References
-
- Al-Lazikani B., Jung J., Xiang Z., Honig B. Curr. Opin. Chem. Biol. 2001;5:51–56. doi:10.1016/S1367-5931(00)00164-2. - DOI - PubMed
-
- Altschul S.F., Madden T.L., Schaffer A.A., Zhang J., Zhang Z., Miller W., Lipman D.J. Nucl. Acids Res. 1997;25:3389–3402. doi:10.1093/nar/25.17.3389. - DOI - PMC - PubMed
-
- Andreeva A., Howorth D., Chandonia J.M., Brenner S.E., Hubbard T.J., Chothia C., Murzin A.G. Nucl. Acids Res. 2008;36:D419–D425. doi:10.1093/nar/gkm993. - DOI - PMC - PubMed
-
- Arakaki A.K., Zhang Y., Skolnick J. Bioinformatics. 2004;20:1087–1096. doi:10.1093/bioinformatics/bth044. - DOI - PubMed
-
- Ashworth J., Havranek J.J., Duarte C.M., Sussman D., Monnat R.J., Jr, Stoddard B.L., Baker D. Nature. 2006;441:656–659. doi:10.1038/nature04818. - DOI - PMC - PubMed
Publication types
MeSH terms
Substances
Grants and funding
LinkOut - more resources
Full Text Sources
Miscellaneous

