. 2010 Jul 15;16(14):3769-78.
doi: 10.1158/1078-0432.CCR-10-0558. Epub 2010 Jun 4.

Intercohort gene expression co-analysis reveals chemokine receptors as prognostic indicators in Ewing's sarcoma

Affiliations

Intercohort gene expression co-analysis reveals chemokine receptors as prognostic indicators in Ewing's sarcoma

Idriss M Bennani-Baiti et al. Clin Cancer Res. .

Abstract

Purpose: We report a novel analytic method, named intercohort co-analysis or Ican, which aids in the discovery of genes with predictive value for the progression or outcome of diseases from small-size cohorts. We tested this premise in Ewing's sarcoma (ES), a highly metastatic cancer of bone and soft tissues that lacks validated molecular metastasis and prognostic indicators.

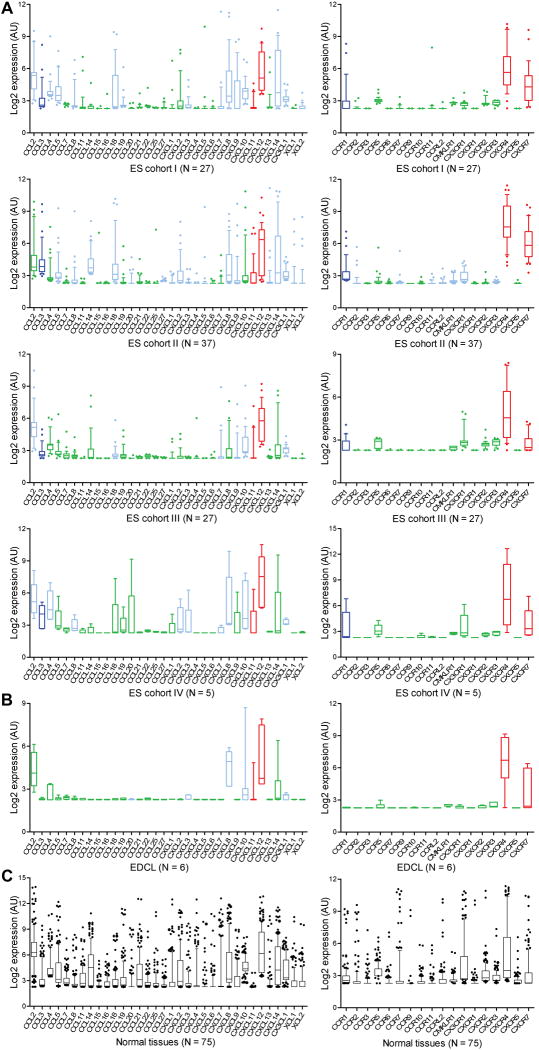
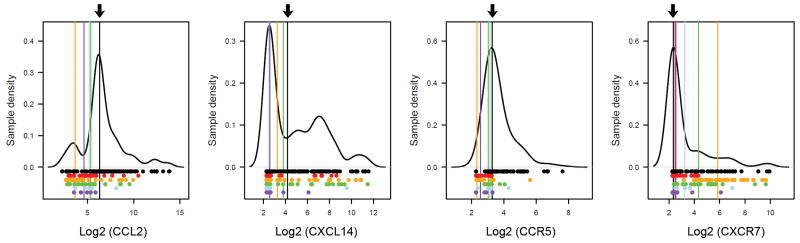
Experimental design: To uncover genes significantly expressed in ES patient subsets, we first determined a nonarbitrary gene expression significance cutoff based on expression levels in validated expressing and nonexpressing tissues. We next searched for genes that were consistently significantly expressed in several ES cohort and cell line datasets. Significantly expressed genes were independently validated by quantitative reverse transcription-PCR in an additional ES cohort.

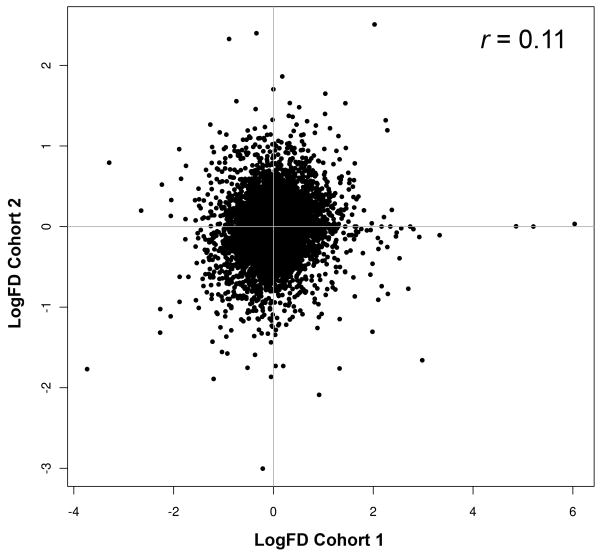
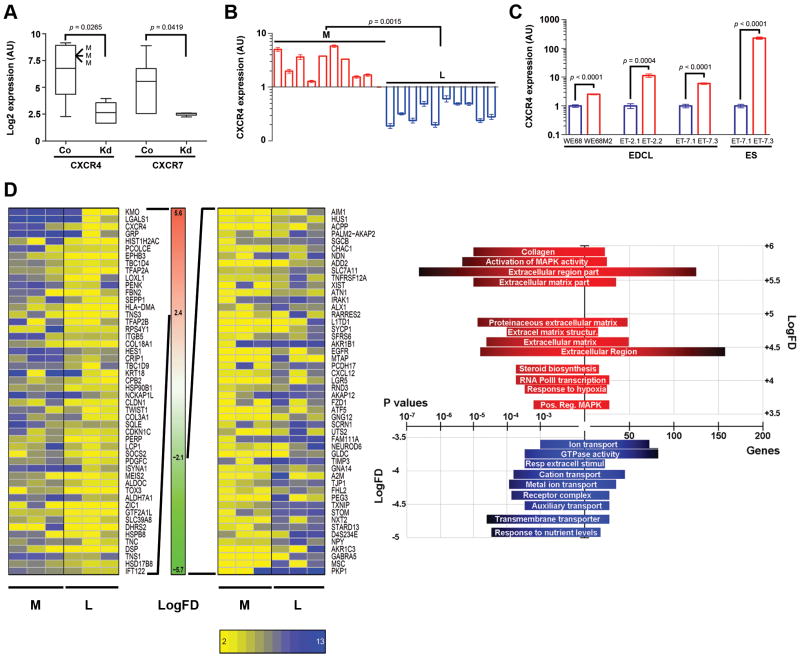
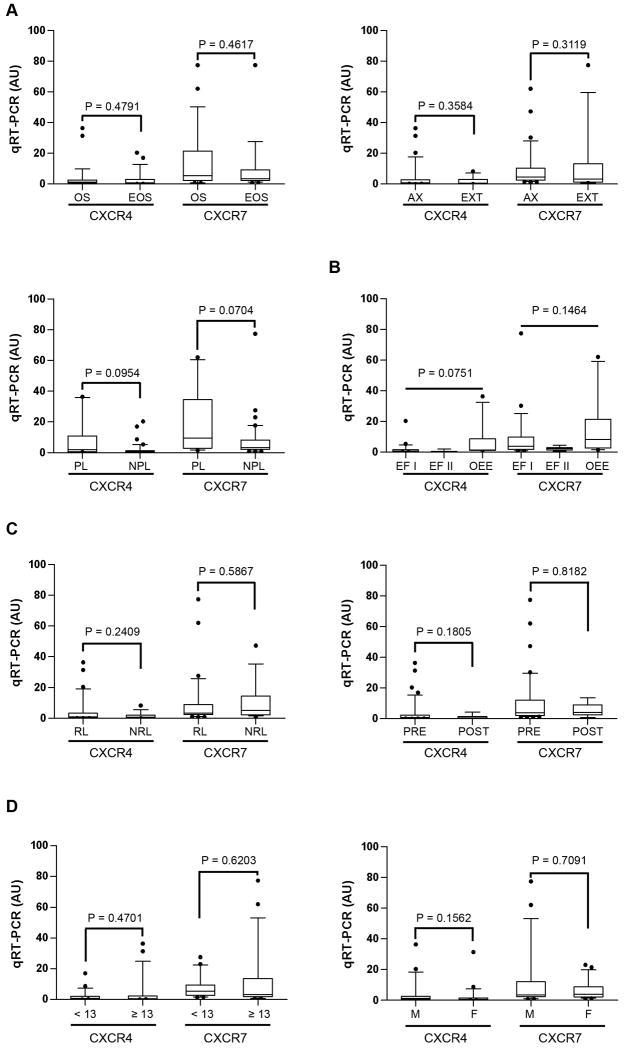
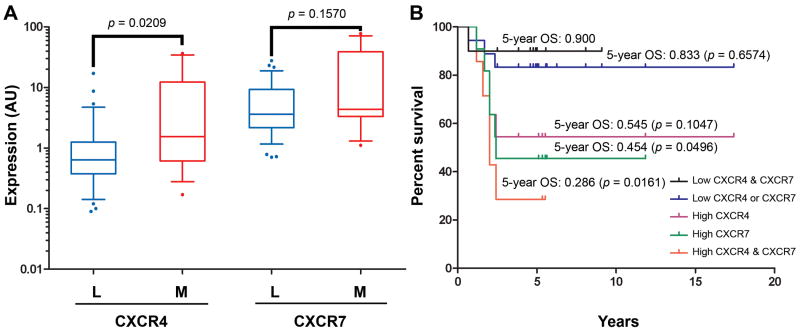
Results: Analysis of ES cohorts revealed marked intercohort gene expression variability. After filtering out the intercohort variability, CXCR4 and CXCR7 were found to be consistently associated with specific ES subsets. Pairwise analyses showed CXCR4 to correlate with ES metastases, and CXCR4 and CXCR7 to patient survival, but not with several other clinicopathological variables.

Conclusion: Ican is a powerful novel method to identifying genes consistently associated with particular disease states in cancers for which large cohorts are not available, currently the case of most cancers. We report for the first time that high CXCR4 expression preferentially associates with metastatic ES, and that of CXCR7 with poor patient survival.


Figures

Fig. 1
Fig. 1. Metastatic versus Localized ES Differential Gene Expression Intercohort Variability
LogFD values of two ES cohorts were plotted against each other. Positive LogFD values on the x and y abscissas denote genes expressed more highly in metastatic than in localized ES, whereas negative LogFD values point to the converse. Genes with -1 < LogFD < 1 were considered not differentially expressed. LogFD = x̄{Log2(M-ES) - Log2(L-ES)}; r: Pearson correlation coefficient.
Fig. 2
Fig. 2. Ican uncovers chemokines and chemokine receptors significantly expressed in ES subsets
Expression levels of chemokines (left panels) and chemokine receptors (right panels) in ES cohorts (A) are shown. Genes whose expression in the top quartile of a given cohort surpassed the median expression in normal tissues (NT; panel C) were deemed significant and depicted in pale blue. Genes consistently expressed in all cohorts are shown in dark blue, and those that are also significantly expressed in ECDL (B) are labeled in red. Expression of all genes tested could readily be detected in cognate NT (C; see also Supplementary Tables 3, 4).
Fig. 3
Fig. 3. Gene expression significance associated with half of ES
Genes whose median expression in ES/EDCL exceeded the median expression in NT (arrows) were deemed significant. As an example, gene expression distributions of CCL2, CXCL14, CCR5 and CXCR7 are shown. The plots depict the density estimation (function “density” in R) of expression in NT. Dots represent single sample expression values in NT (black), ES cohorts (red, orange, green or light blue), or EDCL (purple). Vertical lines indicate median expression values. High intercohort variability is evident from the large spread of medians across the test cohorts.
Fig. 4
Fig. 4. CXCR4 expression correlates to EDCL metastatic origin
A, EWS-FLI1 knockdown decreased CXCR4 and CXCR7 expression in six EDCL (three L-EDCL and three M-EDCL). CXCR4 was highly expressed only in M-EDCL (M). B, qRT-PCR analysis of twenty EDCL validated the preferential high-level CXCR4 expression in M-EDCL. C, qRT-PCR analysis of CXCR4 in cell lines and tumors derived from single patients further confirmed the CXCR4-metastasis association; color coding: localized in blue, metastases in red. D, Gene expression enrichment analysis yielded genes (top and bottom 50 are shown; left panel), and gene-sets (top GO-groups are shown; right panel) enriched in either M-EDCL or L-EDCL. p values and number of genes/gene-sets are shown on split x-axis. LogFD = x̄{Log2(M-EDCL) - Log2(L-EDCL)}. Co: control; Kd: knockdown.
Fig. 5
Fig. 5. CXCR4 and CXCR7 expression does not correlate to several molecular and clinical variables
Several clinicopathological parameters were surveyed in connection with CXCR4 or CXCR7 expression. CXCR4 and CXCR7 did not correlate to: A, tumor location (OS: osseous versus EOS: extra-osseous (EOS) sites; axial (AX) or extremity (EXT) locations, and pelvis (PL) versus non-pelvic (NPL) locations); B, EWS-ETS fusions: EWS-FLI1 type I (EF I), type II (EF II), or other EWS-ETS (OEE) fusions; C, treatment status and outcome: relapsed (RL) versus non-relapsed (NRL) tumors; pre- (PRE) versus post-chemotherapy (POST); D, biographical data such as age (children less than 13-year old versus patients 13-year old or older, or gender (males: M; females: F). Pairwise univariate analyses (nonparametric two-tailed unpaired Mann-Whitney U-tests) were carried out for all analyses to assess significance (p < 0.05), except for data in (B), wherein Bonferroni's multiple comparison testing (significance if p < 0.01) and One-way Anova (p values shown) were used.
Fig. 6
Fig. 6. CXCR4 and CXCR7 associate with metastatic and/or poor prognosis ES
A, qRT-PCR analysis of CXCR4 and CXCR7 expression in localized (L; 36 samples) and metastatic (M; 13 samples) ES confirms the significant association of high CXCR4 (but not CXCR7) expression to ES metastases. B, Kaplan-Meier analysis of overall survival (OS) shows that high expression of either CXCR4 or CXCR7 is detrimental to patient survival. Survival of patients whose tumors highly co-expressed both chemokine receptors was most drastically curtailed. Expression was considered high if above median.

Similar articles

Cited by

References

    1. Easton DF, Pooley KA, Dunning AM, et al. Genome-wide association study identifies novel breast cancer susceptibility loci. Nature. 2007;447:1087–93. - PMC - PubMed
    1. Beer DG, Kardia SL, Huang CC, et al. Gene-expression profiles predict survival of patients with lung adenocarcinoma. Nature medicine. 2002;8:816–24. - PubMed
    1. Varambally S, Yu J, Laxman B, et al. Integrative genomic and proteomic analysis of prostate cancer reveals signatures of metastatic progression. Cancer cell. 2005;8:393–406. - PubMed
    1. Jemal A, Siegel R, Ward E, Hao Y, Xu J, Thun MJ. Cancer statistics, 2009. CA Cancer J Clin. 2009;59:225–49. - PubMed
    1. Brown RC, Dwyer T, Kasten C, et al. Cohort profile: the International Childhood Cancer Cohort Consortium (I4C) Int J Epidemiol. 2007;36:724–30. - PubMed

Publication types