Do airway epithelium air-liquid cultures represent the in vivo airway epithelium transcriptome?
- PMID: 20525805
- PMCID: PMC3095919
- DOI: 10.1165/rcmb.2009-0453OC
Do airway epithelium air-liquid cultures represent the in vivo airway epithelium transcriptome?
Abstract
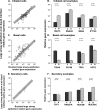
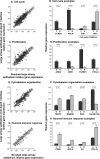
Human airway epithelial cells cultured in vitro at the air-liquid interface (ALI) form a pseudostratified epithelium that forms tight junctions and cilia, and produces mucin. These cells are widely used in models of differentiation, injury, and repair. To assess how closely the transcriptome of ALI epithelium matches that of in vivo airway epithelial cells, we used microarrays to compare the transcriptome of human large airway epithelial cells cultured at the ALI with the transcriptome of large airway epithelium obtained via bronchoscopy and brushing. Gene expression profiling showed that global gene expression correlated well between ALI cells and brushed cells, but with some differences. Gene expression patterns mirrored differences in proportions of cell types (ALIs have higher percentages of basal cells, whereas brushed cells have higher percentages of ciliated cells), that is, ALI cells expressed higher levels of basal cell-related genes, and brushed cells expressed higher levels of cilia-related genes. Pathway analysis showed that ALI cells had increased expression of cell cycle and proliferation genes, whereas brushed cells had increased expression of cytoskeletal organization and humoral immune response genes. Overall, ALI cells provide a good representation of the in vivo airway epithelial transcriptome, but for some biologic questions, the differences between in vitro and in vivo environments need to be considered.
Figures


Similar articles
-
Characterization of pediatric cystic fibrosis airway epithelial cell cultures at the air-liquid interface obtained by non-invasive nasal cytology brush sampling.Respir Res. 2017 Dec 28;18(1):215. doi: 10.1186/s12931-017-0706-7. Respir Res. 2017. PMID: 29282053 Free PMC article.
-
Strong correlation between air-liquid interface cultures and in vivo transcriptomics of nasal brush biopsy.Am J Physiol Lung Cell Mol Physiol. 2020 May 1;318(5):L1056-L1062. doi: 10.1152/ajplung.00050.2020. Epub 2020 Apr 1. Am J Physiol Lung Cell Mol Physiol. 2020. PMID: 32233789 Free PMC article.
-
Transcriptional profiling of mucociliary differentiation in human airway epithelial cells.Am J Respir Cell Mol Biol. 2007 Aug;37(2):169-85. doi: 10.1165/rcmb.2006-0466OC. Epub 2007 Apr 5. Am J Respir Cell Mol Biol. 2007. PMID: 17413031
-
Air-liquid interface (ALI) impact on different respiratory cell cultures.Eur J Pharm Biopharm. 2023 Mar;184:62-82. doi: 10.1016/j.ejpb.2023.01.013. Epub 2023 Jan 22. Eur J Pharm Biopharm. 2023. PMID: 36696943 Review.
-
Air-liquid interface cell culture: From airway epithelium to the female reproductive tract.Reprod Domest Anim. 2019 Sep;54 Suppl 3:38-45. doi: 10.1111/rda.13481. Reprod Domest Anim. 2019. PMID: 31512315 Review.
Cited by
-
A microfluidic device to apply shear stresses to polarizing ciliated airway epithelium using air flow.Biomicrofluidics. 2014 Nov 14;8(6):064104. doi: 10.1063/1.4901930. eCollection 2014 Nov. Biomicrofluidics. 2014. PMID: 25553181 Free PMC article.
-
Stem cell-based Lung-on-Chips: The best of both worlds?Adv Drug Deliv Rev. 2019 Feb 1;140:12-32. doi: 10.1016/j.addr.2018.07.005. Epub 2018 Jul 25. Adv Drug Deliv Rev. 2019. PMID: 30009883 Free PMC article. Review.
-
Human airway construct model is suitable for studying transcriptome changes associated with indoor air particulate matter toxicity.Indoor Air. 2020 May;30(3):433-444. doi: 10.1111/ina.12637. Epub 2020 Jan 23. Indoor Air. 2020. PMID: 31883508 Free PMC article.
-
Comparison of immune response to human rhinovirus C and respiratory syncytial virus in highly differentiated human airway epithelial cells.Virol J. 2022 May 15;19(1):81. doi: 10.1186/s12985-022-01805-2. Virol J. 2022. PMID: 35570279 Free PMC article.
-
Development of a novel air-liquid interface airway tissue equivalent model for in vitro respiratory modeling studies.Sci Rep. 2023 Jun 22;13(1):10137. doi: 10.1038/s41598-023-36863-1. Sci Rep. 2023. PMID: 37349353 Free PMC article.
References
-
- Breeze RG, Wheeldon EB. The cells of the pulmonary airways. Am Rev Respir Dis 1977;116:705–777. - PubMed
-
- Robbins RA, Rennard SI. Biology of airway epithelial cells. In: Crystal RG, West JB, Weibel ER, Barnes PJ, editors. The lung, 2nd ed. Philadelphia: Lippincott Raven Publishers; 1997. p. 445–458.
-
- Knight DA, Holgate ST. The airway epithelium: structural and functional properties in health and disease. Respirology 2003;8:432–446. - PubMed
-
- Rawlins EL, Hogan BL. Epithelial stem cells of the lung: privileged few or opportunities for many? Development 2006;133:2455–2465. - PubMed
Publication types
MeSH terms
Grants and funding
LinkOut - more resources
Full Text Sources
Other Literature Sources
Molecular Biology Databases

