. 2011 Apr;44(4):483-90.
doi: 10.1165/rcmb.2009-0391OC. Epub 2010 Jun 4.

Endothelial dysfunction and claudin 5 regulation during acrolein-induced lung injury

Affiliations

Endothelial dysfunction and claudin 5 regulation during acrolein-induced lung injury

An Soo Jang et al. Am J Respir Cell Mol Biol. 2011 Apr.

Abstract

An integral membrane protein, Claudin 5 (CLDN5), is a critical component of endothelial tight junctions that control pericellular permeability. Breaching of endothelial barriers is a key event in the development of pulmonary edema during acute lung injury (ALI). A major irritant in smoke, acrolein can induce ALI possibly by altering CLDN5 expression. This study sought to determine the cell signaling mechanism controlling endothelial CLDN5 expression during ALI. To assess susceptibility, 12 mouse strains were exposed to acrolein (10 ppm, 24 h), and survival monitored. Histology, lavage protein, and CLDN5 transcripts were measured in the lung of the most sensitive and resistant strains. CLDN5 transcripts and phosphorylation status of forkhead box O1 (FOXO1) and catenin (cadherin-associated protein) beta 1 (CTNNB1) proteins were determined in control and acrolein-treated human endothelial cells. Mean survival time (MST) varied more than 2-fold among strains with the susceptible (BALB/cByJ) and resistant (129X1/SvJ) strains (MST, 17.3 ± 1.9 h vs. 41.4 ± 5.1 h, respectively). Histological analysis revealed earlier perivascular enlargement in the BALB/cByJ than in 129X1/SvJ mouse lung. Lung CLDN5 transcript and protein increased more in the resistant strain than in the susceptible strain. In human endothelial cells, 30 nM acrolein increased CLDN5 transcripts and increased p-FOXO1 protein levels. The phosphatidylinositol 3-kinase inhibitor LY294002 diminished the acrolein-induced increased CLDN5 transcript. Acrolein (300 nM) decreased CLDN5 transcripts, which were accompanied by increased FOXO1 and CTNNB1. The phosphorylation status of these transcription factors was consistent with the observed CLDN5 alteration. Preservation of endothelial CLDN5 may be a novel clinical approach for ALI therapy.


Figures
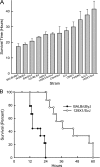
Figure 1.
Figure 1.
(A) Mean survival time (MST) of 12 mouse strains after acrolein exposure. MST varied among mouse strains, with the most susceptible (BALB/cByJ) and resistant (129X1/SvJ) mouse strains varying more than 2-fold (MST, 17.3 ± 1.9 h vs. 41.4 ± 5.1 h, respectively). Mice (n = 9 mice per strain) were exposed to acrolein (10 ppm, 24 h) under specific pathogen-free conditions. (B) Survival curves for the sensitive (BALB/cByJ) and resistant (129X1/SvJ) mouse strains. Between-strain survival time was significantly different using the Kaplan-Meyer method (P < 0.001).
Figure 2.
Figure 2.
Mouse strains vary in pathophysiological response to acrolein-induced lung pathology. Histological assessment of lung tissue from (A) control (filtered air) BALB/cByJ mice, (B) control (filtered air) 129X1/SvJ mice, (C, E) acrolein (10 ppm, 12 h) exposed BALB/cByJ mice, or (D, F) acrolein (10 ppm, 17 h) exposed 129X1/SvJ mice. Compare (arrow) area around blood vessel from (C) acrolein-treated with (A) control. In the sensitive BALB/cByJ strain, perivascular enlargement was present at 12 hours of exposure. Leukocytes were present in the (C) perivascular space and (E) alveolus in acrolein-treated BALB/cByJ mouse lung. (D) Perivascular enlargement was not as evident in the lungs of the resistant 129X1/SvJ strain as compared with the BALB/cByJ strain after acrolein exposure. (F) Leukocytes present in alveolus were less in the 129X1/SvJ strain as compared with the BALB/cByJ strain. Bar indicates magnification of original image obtained from 5-μM sections prepared with hematoxylin and eosin stain (50 μm in A–D and 10 μm in E and F). (G) The perivascular interstitial space increased more in lung of BALB/cByJ than of 129X1/SvJ mouse strains after acrolein exposure. After acrolein exposure, the length of the distance between the tunica media and the tunica adventitia (median with 25 and 75% confidence intervals in parentheses) increased from control = 2.6 (1.8–3.3) μm to exposed = 16.6 (11.3–24.7) μm in the lung of BALB/cByJ mice and from control = 1.9 (1.4–2.9) μm to exposed = 4.1 (2.8–5.8) μm in the lung of 129X1/SvJ mice. Values plotted indicate the median (line in box) with 25 and 75% confidence intervals (borders of the box) and 95% confidence intervals (error bars). *Statistically (P < 0.001) different from strain-matched control mice (filtered air) as determined by Kruskal-Wallis ANOVA on ranks followed by pairwise comparison with the Tukey method.
Figure 3.
Figure 3.
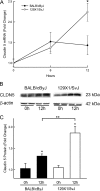
Lung Claudin 5 (CLDN5) transcript and protein increased more in the resistant mouse strain (129X1/SvJ) than in the sensitive mouse strain (BALB/cByJ) after acrolein exposure. (A) CLDN5 transcript increased more at 12 hours in 129X1/SvJ than in BALB/cByJ mouse lung. Mice were exposed to control (filtered air, 0 h) or 10 ppm acrolein for 6 or 12 hours, and lung mRNA was analyzed by qRT-PCR. Values are mean ± SE (n = 8 mice per group). At 12 hours, lung CLDN5 transcript levels increased in resistant (129X1/SvJ) mice compared with strain-matched control mice, whereas the lung CLDN5 transcript levels in the sensitive (BALB/cByJ) mice were not significantly different from control mice. *Significantly different (P < 0.0001) from strain-matched control mice as determined by ANOVA with an all pairwise multiple comparison procedure (Holm-Sidak method). (B) CLDN5 protein increased more at 12 hours in 129X1/SvJ than in BALB/cByJ mouse lung as determined by Western blot. Each lane represents protein from a single mouse. (C) CLDN5 protein increased more at 12 hours in 129X1/SvJ than in BALB/cByJ mouse lung. Each test was repeated four times and quantified using ImageQuant 5.2 software (Typhoon 9410; GE Healthcare, Piscataway, NJ). Values are mean ± SE (n = 4) normalized to β-actin. *Significantly different (P < 0.05) from strain-matched control mice (0 h) as determined by ANOVA with an all pairwise multiple comparison procedure (Holm-Sidak method). **Significantly different (P < 0.001) between 12 hour–exposed 129X1/SvJ and 12 hour–exposed BALB/cByJ mice as determined by ANOVA with an all pairwise multiple comparison procedure (Holm-Sidak method).
Figure 4.
Figure 4.
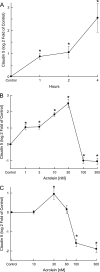
Acrolein alters CLDN5 transcript in vitro. (A) Time course of acrolein-induced CLDN5 transcript increases in EA.hy926 cells. Cells were exposed to 30 nM acrolein for the indicated times, and mRNA was analyzed by qRT-PCR. Tests were repeated on three occasions. Values are mean ± SE (n = 12 dishes). *Significantly different (P < 0.001) from Dulbecco's PBS (control) as determined by ANOVA with an all pairwise multiple comparison procedure (Holm-Sidak method). (B) Dose response of acrolein-induced CLDN5 transcript in hybrid EA.hy926 cells. Cells were exposed to acrolein for 4 hours, and mRNA expression levels were analyzed by qRT-PCR. Tests were repeated on three occasions. Values are mean ± SE (n = 12 dishes). *Significantly different (P < 0.001) from control as determined by ANOVA with an all pairwise multiple comparison procedure (Holm-Sidak method). (C) Dose response of acrolein-induced CLDN5 transcript in human lung microvascular endothelial cells. Cells were exposed to acrolein for 4 hours, and mRNA was analyzed by qRT-PCR. Tests were repeated on three occasions. Values are mean ± SE (n = 12 dishes). *Significantly different (P < 0.001) from control as determined by ANOVA with an all pairwise multiple comparison procedure (Holm-Sidak method).
Figure 5.
Figure 5.
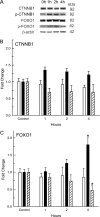
Phospho-forkhead box O1 (p-FOXO1) increased after 30 nM of acrolein treatment. (A) Western immunoblot with catenin (cadherin-associated protein), beta 1 (CTNNB1), p-CTNNB1, FOXO1, p-FOXO1, or β-actin antibody in EA.hy926 cells treated with Dulbecco's PBS (control) or 30 nM acrolein. p-FOXO1 increased after 4 hours of 30 nM acrolein treatment. (B) Mean transcription factor CTNNB1 protein levels after 30 nM acrolein treatment. Open bar: CTNNB1. Closed bar: p-CTNNB1. Hatched bar: CTNNB1/p-CTNNB1 ratio. (C) Mean transcription factor FOXO1 protein levels after 30 nM acrolein treatment. Open bar: FOXO1. Closed bar: p-FOXO1; Hatched bar: FOXO1/p-FOXO ratio. Each test was repeated four times and quantified using ImageQuant 5.2 software (Typhoon 9410; GE Healthcare). Values are mean ± SE (n = 4) normalized to β-actin. *Significantly different (P < 0.001) from control as determined by ANOVA with an all pairwise multiple comparison procedure (Holm-Sidak method).
Figure 6.
Figure 6.
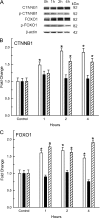
Catenin (cadherin-associated protein), beta 1 (CTNNB1), and Forkhead box O1 (FOXO1) increased, whereas phospho-FOXO1 (p-FOXO1) and phospho-CTNNB1 (p-CTNNB1) were unchanged after treatment with 300 nM acrolein. (A) Western immunoblot with CTNNB1, p-CTNNB1, FOXO1, p-FOXO1, or β-actin antibody in EA.hy926 cells treated with Dulbecco's PBS (control) or 30 nM acrolein. CTNNB1 and FOXO1 increased at 1, 2, or 4 hours of 300-nM acrolein treatment. (B) Mean transcription factor CTNNB1 proteins after 300 nM acrolein treatment. Open bar: CTNNB1. Closed bar: p-CTNNB1. Hatched bar: CTNNB1/p-CTNNB1 ratio. (C) Mean transcription factor FOXO1 proteins after 300 nM acrolein treatment. Open bar: FOXO1. Closed bar: p-FOXO1. Hatched bar: FOXO1/p-FOXO ratio. Each test was repeated four times and quantified using ImageQuant 5.2 software (Typhoon 9410; GE Healthcare). Values are mean ± SE (n = 4) normalized to β-actin. *Significantly different (P < 0.01) from control as determined by ANOVA with an all pairwise multiple comparison procedure (Holm-Sidak method).
Figure 7.
Figure 7.
Phosphatidylinositol 3-kinase inhibitor, LY294002 (LY), diminishes 30 nM acrolein-induced increased claudin 5 (CLDN5) transcript in EA.hy926 cells untreated (control) or cells treated with DMSO (vehicle), 30 nM acrolein, or 30 nM acrolein and LY. Cells were treated with vehicle (DMSO) or 10 μM LY 30 minutes before 30 nM acrolein treatment, and mRNA was analyzed by qRT-PCR. Tests were repeated four times on two occasions. Values are mean ± SE (n = 8 dishes). *Significantly different (P < 0.01) from vehicle (Dulbecco's buffered saline or DMSO) control as determined by ANOVA with an all pairwise multiple comparison procedure (Holm-Sidak method). **Significantly different (P < 0.01) from acrolein (without LY) as determined by ANOVA with an all pairwise multiple comparison procedure (Sidak-Scheffe method).

Similar articles

Cited by

References

    1. Gavard J, Gutkind JS. VE-cadherin and claudin-5: it takes two to tango. Nat Cell Biol 2008;10:883–885. - PMC - PubMed
    1. Tsukita S, Furuse M, Itoh M. Multifunctional strands in tight junctions. Nat Rev Mol Cell Biol 2001;2:285–293. - PubMed
    1. Dejana E. Endothelial cell-cell junctions: happy together. Nat Rev Mol Cell Biol 2004;5:261–270. - PubMed
    1. Argaw AT, Gurfein BT, Zhang Y, Zameer A, John GR. VEGF-mediated disruption of endothelial CLN-5 promotes blood-brain barrier breakdown. Proc Natl Acad Sci USA 2009;106:1977–1982. - PMC - PubMed
    1. Rosenberg GA, Yang Y. Vasogenic edema due to tight junction disruption by matrix metalloproteinases in cerebral ischemia. Neurosurg Focus 2007;22:E4. - PubMed

Publication types

MeSH terms