. 2010 Jun;22(6):1998-2016.
doi: 10.1105/tpc.109.070961. Epub 2010 Jun 4.

Arabidopsis small ubiquitin-like modifier paralogs have distinct functions in development and defense

Affiliations

Arabidopsis small ubiquitin-like modifier paralogs have distinct functions in development and defense

Harrold A van den Burg et al. Plant Cell. 2010 Jun.

Abstract

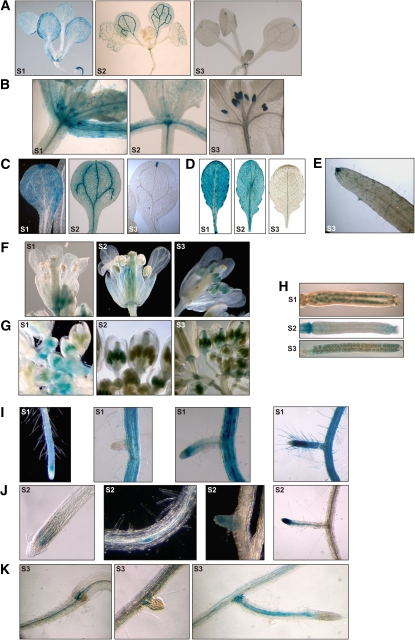
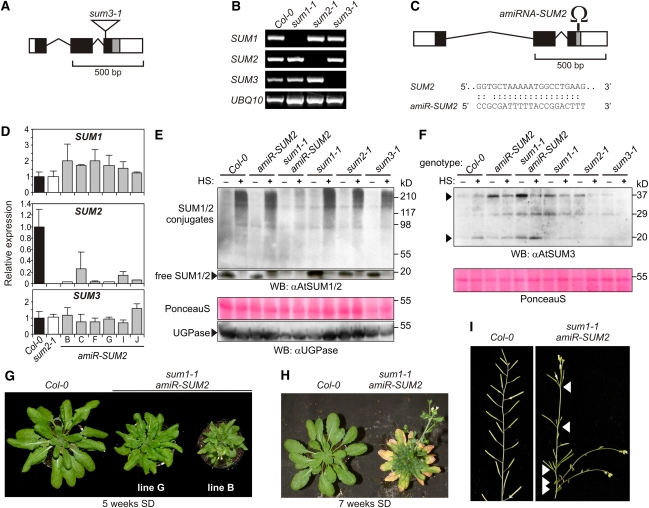
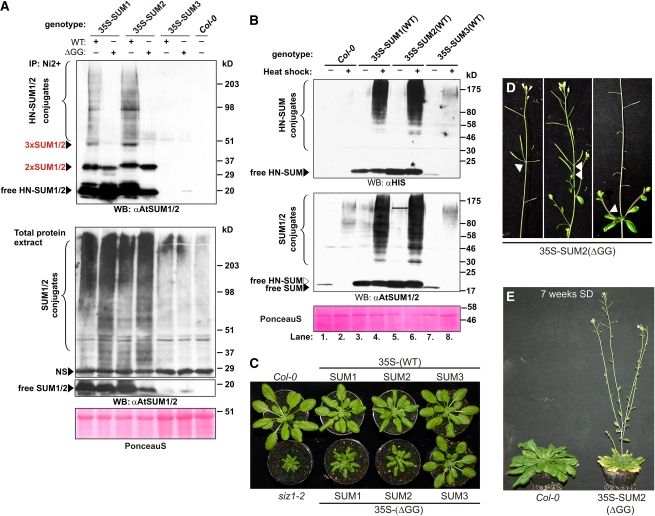
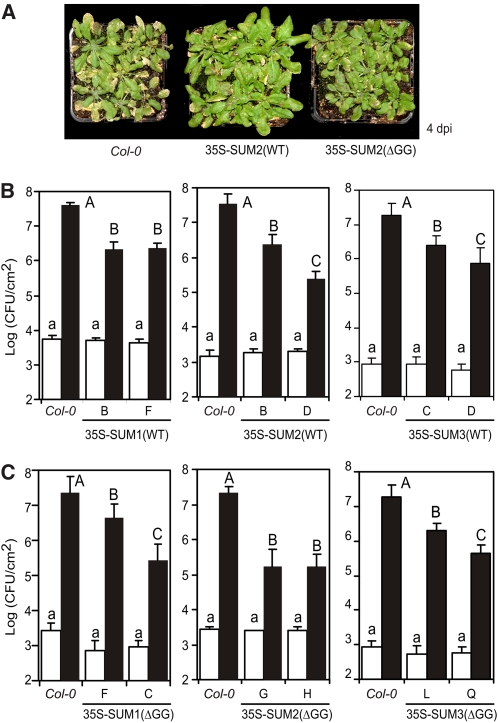
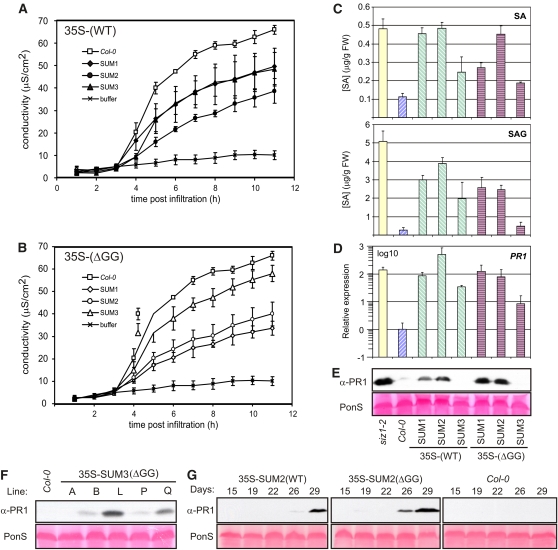
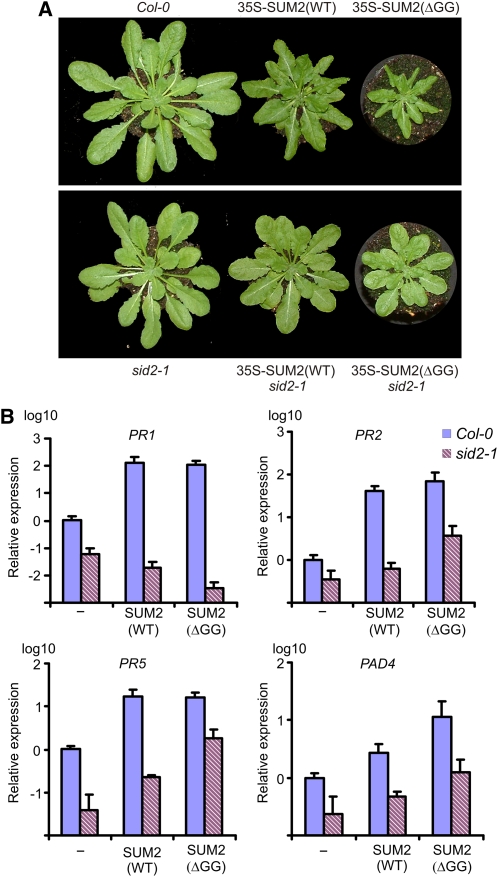
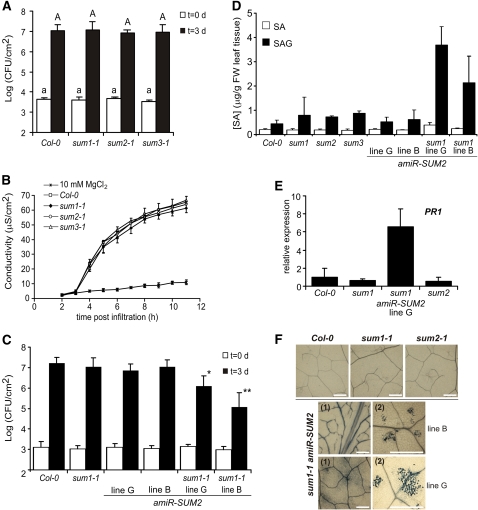
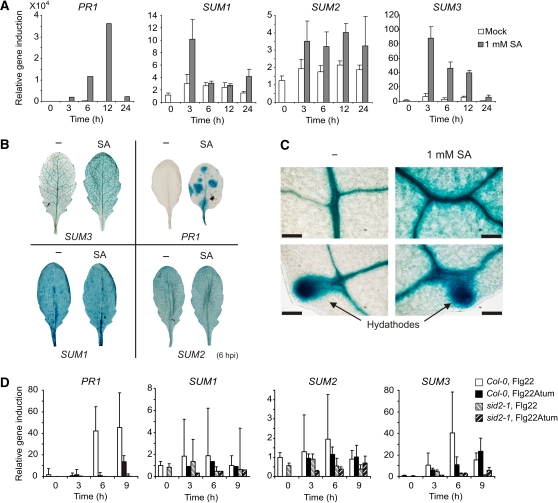
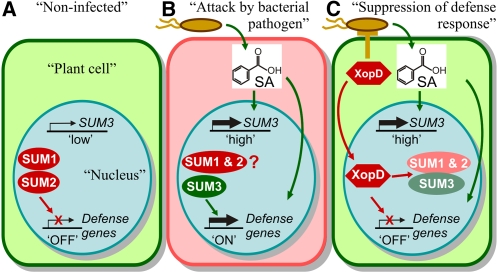
Posttranslational modifications allow dynamic and reversible changes to protein function. In Arabidopsis thaliana, a small gene family encodes paralogs of the small ubiquitin-like posttranslational modifier. We studied the function of these paralogs. Single mutants of the SUM1 and SUM2 paralogs do not exhibit a clear phenotype. However, the corresponding double knockdown mutant revealed that SUM1 and SUM2 are essential for plant development, floral transition, and suppression of salicylic acid (SA)-dependent defense responses. The SUM1 and SUM2 genes are constitutively expressed, but their spatial expression patterns do not overlap. Tight transcriptional regulation of these two SUM genes appears to be important, as overexpression of either wild-type or conjugation-deficient mutants resulted in activation of SA-dependent defense responses, as did the sum1 sum2 knockdown mutant. Interestingly, expression of the paralog SUM3 is strongly and widely induced by SA and by the defense elicitor Flg22, whereas its expression is otherwise low and restricted to a few specific cell types. Loss of SUM3 does not result in an aberrant developmental phenotype except for late flowering, while SUM3 overexpression causes early flowering and activates plant defense. Apparently, SUM3 promotes plant defense downstream of SA, while SUM1 and SUM2 together prevent SA accumulation in noninfected plants.


Figures

Figure 1.
Figure 1.
Expression Patterns of the SUM1, SUM2, and SUM3 Genes. Localization of GUS reporter activity in Arabidopsis plants transformed with SUMO promoter-GUS reporter gene fusions (S1, ProSUM1-GUS; S2, ProSUM2-GUS; and S3, ProSUM3-GUS). GUS localizations were examined in leaf tissue ([A] to [E]), floral development ([F] and [G]), siliques (H), and roots ([I] to [K]). At least four independent transgenic lines were examined per construct.
Figure 2.
Figure 2.
SUM1 and SUM2 Jointly Regulate Plant Development. (A) To scale diagram of the SUM3 gene and the location of the T-DNA insertion (arrowhead) that interrupts the reading frame at Met-78 in sum3-1. Exons and introns are represented by boxes and bent lines, respectively. White, black, and gray boxes reflect the 5′/3′-untranslated regions, the coding region of the mature SUM3 protein, and the C terminus removed during maturation, respectively. (B) RT-PCR analysis confirmed the null alleles for the sum1-1, sum2-1, and sum3-1 genotypes (wild-type Col-0 was included as positive control, n = 4). Left, target gene amplified by PCR; top, genotype tested. PCR was performed for 30 cycles. UBQ10 mRNA was amplified as a positive control for PCR amplification. (C) To scale diagram of the SUM2 gene with the amiR-SUM2 target site indicated (Ω) in the C-terminal extension, which is removed during maturation. Schematic organization as in (A). Bottom, the sequence of amiR and the target sequence in SUM2. (D) Introduction of amiR-SUM2 in Arabidopsis resulted in SUM2 silencing without silencing of SUM1 or SUM3, as shown using qRT-PCR. Wild-type (Col-0) and sum2-1 were included as controls for SUM2 expression. Depicted are the mean expression levels ± sd. The biological samples (n = 4) were normalized using TUB4 expression, and the y axis shows the relative expression levels of the SUM genes in the different lines compared with the level found in wild-type plants. (E) Homozygous sum1-1 amiR-SUM2 seedlings showed reduced levels of both free SUM1/2 and SUM1/2 conjugates in response to heat shock (HS). SUMO conjugation levels were detected in total protein extracts using antibody against SUM1/2 (αAtSUM1/2). PonceauS stain and the αUPGase immunoblot (WB: αUPGase) are shown as a control for equal protein loading. +, HS; −, no HS. (F) The sum1-1 amiR-SUM2 double knockdown showed increased accumulation of SUM3 protein (arrowheads). Other conditions the same as for (E). (G) to (I) SUM1 and SUM2 act redundantly in plant development, as independent sum1 amiR-SUM2 lines showed strong dwarfism (G), leaf crooking, occasional leaf fusion, shortened petioles, early leaf senescence combined with early flowering under SDs (H), reduced apical dominance, partial sterility (I) (arrowheads pointing left), and disrupted inflorescence patterning leading to up to five developing siliques at single node positions (arrowheads pointing right).
Figure 3.
Figure 3.
Overexpression of the Conjugation-Deficient Mutant SUM1(ΔGG) or SUM2(ΔGG) Resulted in Similar Growth Phenotypes as the siz1 and sum1 amiR-SUM2 Mutants. (A) Overexpression of both mature (WT) and a conjugation-deficient (ΔGG) mutant of HN-tagged SUM1 and SUM2 resulted in increased SUM1/2 conjugation levels in 5-week-old plants. By contrast, overexpression of SUM3 (both WT and ΔGG) did not lead to increased conjugation of SUM1 or SUM2. SUM1(ΔGG) and SUM2(ΔGG) are not conjugated to target protein, but they are themselves SUMOylated by endogenous SUMO, resulting in a covalent SUMO dimer (2xSUM1/2). The wild type (Col-0) was included as control. Top panel (IP: Ni2+), pull-down of the HN-tagged protein fraction with Ni2+ resin; bottom panels, total protein extract (6 M GuCl and 20 mM NEM). Blots were probed with αAtSUM1/2 antibody. The nonspecific signal (NS) and PonceauS staining are shown as control for equal protein loading. 3xSUM1/2, protein complex containing three SUMO proteins. (B) Seedlings overexpressing mature SUMO showed increased SUMOylation in response to heat shock compared with control plants (nontransgenic Col-0). HN-tagged SUM3(WT) is also conjugated to targets in response to heat shock (WB:αHIS, lane 8). (C) Overexpression of SUM1(ΔGG) or SUM2(ΔGG) resulted in strong leaf curling, dwarfism, leaf crooking, and shortened petioles, similar to the siz1 mutant. In comparison, overexpression of mature SUM1 and SUM2 (WT) protein caused mild dwarfism and reduced petiole length, while overexpression of SUM3 (WT and ΔGG) did not trigger any visible developmental defects. Plants were grown under SD conditions. (D) Overexpression of SUM2(ΔGG) resulted in disturbed inflorescence patterning and partial sterility (arrowheads). Similar observations were made for SUM1(ΔGG). (E) Overexpression of SUM2(ΔGG) resulted in early flowering and increased senescence. Plants were grown for 7 weeks under SD conditions.
Figure 4.
Figure 4.
Overexpression of SUMO Variants in Arabidopsis Resulted in Increased Resistance to PstDC3000. (A) Arabidopsis expressing 35S-SUM2 (WT or ΔGG) showed reduced disease symptoms (water-soaked lesions, chlorosis, and necrosis) in comparison to wild-type plants (Col-0). Photographs were taken 4 d postinoculation (dpi) with PstDC3000. (B) Wild-type plants (Col-0) and two independent transgenic lines expressing relatively high levels of mature SUM1, SUM2, or SUM3 were inoculated with PstDC3000. Depicted are the mean log bacterial counts ± se (white bars, t = 0 dpi; black bars, t = 3 dpi). Different letters above the bars indicate significant differences in mean log bacterial count at P = 0.05 using an analysis of variance (n = 8 plants; lowercase a, t = 0 dpi; CAPS A/B/C, t = 3 dpi). The experiment was repeated three times with similar results. (C) Similar as in (B), except that plants tested expressed at relatively high levels a conjugation-deficient mutant (ΔGG) of the indicated SUMO paralog.
Figure 5.
Figure 5.
Overexpression of SUMO Variants in Arabidopsis Resulted in Reduced HR and Increased Accumulation of SA. (A) Overexpression of mature SUMO paralogs (35S-WT) resulted in reduced HR (as indicated by reduced ion leakage compared with the control) upon inoculation with Pst expressing avrRpm1. Symbols represent the mean ± sd conductivity measured per genotype. As negative control, buffer only (10 mM MgCl2) was infiltrated in wild-type plants (Col-0). (B) Similar as (A), except that plants were tested that overexpress a conjugation-deficient SUMO mutant (35S-ΔGG). (C) Overexpression of SUMO variants resulted in accumulation of free SA and SAG in 5-week-old SD-grown plants. As controls, the siz1-2 mutant (yellow) and wild-type plants (Col-0; blue) were included (bars represent mean ± sd; n = 4 samples per line). (D) High expressors of 35S-SUM1 and -SUM2 (both WT and ΔGG) show increased expression of the SA marker gene PR1, similar to the siz1 mutant, while 35S-SUM3 plants show intermediate expression of PR1. Expression levels were determined using qRT-PCR. RNA was extracted from 17-d-old LD-grown seedlings. The biological samples (n = 4) were normalized using TUB4 expression, and the mean expression of PR1 in Col-0 was set at 1. Experiment was repeated three times with similar results. (E) Plants expressing high levels of SUM1 or SUM2 (both WT and ΔGG) showed accumulation of PR1 protein (αPR1 antibody) similar to the siz1 mutant. Total protein extracts were prepared from 17-d-old seedlings grown under LD conditions. PonseauS (PonS) staining of the blot confirmed equal protein loading. At least two independent transgenic lines were examined per construct. (F) Similar as in (E), except that enhanced exposure of the blot revealed that transgenic lines overexpressing 35S-SUM3(ΔGG) also showed increased PR1 protein accumulation. PR1 protein levels in these lines were lower than those observed for 35S-SUM1 and 35S-SUM2 (both WT and ΔGG), as shown in Figure 3E. (G) Similar as in (E), except that total protein extracts were prepared from plants grown under SD conditions. Top: genotype tested (top). Accumulation of the PR1 protein is age dependent in plants that overexpress SUM2 variants. [See online article for color version of this figure.]
Figure 6.
Figure 6.
The Developmental Phenotype Caused by Overexpression of SUM2 Variants Is Largely ICS1(SID2 Dependent. (A) Developmental phenotype of 35S-SUM2 (both WT and ΔGG) plants was largely ICS1 dependent. The sid2-1 allele of ICS1 is in the Col-0 background. (B) Induction of the SA-marker genes (PR1, PR2, PR5, and PAD4) following overexpression of mature SUM2 (WT or ΔGG) is ICS1 dependent. Relative expression levels were determined for the indicated genes using qRT-PCR in 4-week-old plants grown under SDs. Individual biological samples (n = 4 with two technical replicates per plate) were normalized against TUB4 expression, and the mean expression in the control (Col-0) was set at 1 (log10 = 0). Error bars represent sd. [See online article for color version of this figure.]
Figure 7.
Figure 7.
SUM1 and SUM2 Together Are Essential to Prevent Constitutive Activation of SA-Dependent Plant Defense Responses. (A) SUM null alleles (sum1-1, sum2-1, and sum3-1) did not show significantly different resistance to PstDC3000 than the control (wild-type Col-0), as determined by analysis of variance of the mean log bacterial count at t = 0 d (group a) or t = 3 d (group A). Depicted are mean log bacterial counts ± se (n = 8 samples). Data are from one representative experiment (n = 3). (B) Loss of a single SUMO paralog did not impair ion leakage (HR induction) triggered by Pst expressing avrRpm1. Means ± sd were determined using four leaf discs per genotype. Symbols represent the genotypes indicated. As control, we infiltrated leaf discs with buffer only (10 mM MgCl2). Data are from one representative experiment (n = 3). (C) The sum1-1 amiR-SUM2 double mutant shows enhanced resistance to PstDC3000. Depicted is mean log bacterial growth ± se (n = 8) for two independent crosses of sum1-1 amiR-SUM2 (lines B and G) and the parental lines. The asterisk above the bars indicates significant differences in mean log bacterial count at *P = 0.05 and **P = 0.01 (pair-wise Student's t test with the parents). The assay was repeated three times with similar results. (D) The sum1-1 amiR-SUM2 double mutant showed increased accumulation of free SA and SAG in comparison to the parental lines and wild-type plants (Col-0). Bars represent means ± sd (n = 4). Five-week-old SD-grown plants were sampled. The assay was repeated three times with similar results. FW, fresh weight. (E) The sum1-1 amiR-SUM2 double mutant showed at least 10-fold increased PR1 expression levels compared with control plants. RNA was extracted from 17-d-old seedlings grown under LD conditions. Individual biological samples were normalized against TUB4 expression, and the mean expression in the wild-type plants (Col-0) was set to 1. (F) The sum1-1 amiR-SUM2 double mutant developed spontaneous cell death in the vasculature (1) and individual cells and cells clusters (2). Cell death was visualized using lactophenol trypan blue staining. Wild-type (Col-0), sum1-1, and sum2-1 plants did not show cell death at the same stage of plant development. Bar = 500 μM. [See online article for color version of this figure.]
Figure 8.
Figure 8.
SUM3 Is Rapidly and Transiently Induced by Flg22 Treatment in an SA-Dependent Manner. (A) Expression levels of SUM1, SUM2, SUM3, and PR1 were determined with qPCR over a time course of 24 h after subjecting 4-week-old plants to 1 mM SA (gray bars) or mock treatment (white bars). Both SUM3 (>80-fold) and SUM1 (3- to 5-fold) showed a transient increase in expression in response to SA. Biological samples were normalized using TUB4 expression levels, and the average expression levels of the four genes was scaled to 1 for t = 0. Four biological samples were taken per time point, and the error bars represent sd. Data are from one representative experiment (n = 3). (B) Localization of GUS reporter activity in Arabidopsis expressing the GUS reporter gene under the control of the SUM1, SUM2, or SUM3 promoters 6 h after treatment with 1 mM SA or mock treatment (−). Only the SUM3 promoter is SA sensitive based on GUS staining intensities. Similar observations were made for two other ProSUM3-GUS lines. The ProPR1-GUS line (PR1) is shown as a positive control for SA-dependent gene induction. hpi, hours post infection. (C) Magnification of the Arabidopsis ProSUM3-GUS leaves 6 h after treatment with SA or mock treatment (−) revealed GUS staining in leaf mesophyl cells in response to SA treatment. Bar = 100 μM. (D) Expression of SUM1, SUM2, and SUM3 and the SA marker gene PR1 at various time points after infiltration with 10 μM Flg22 (white and gray hatched bars) or Flg22Atum peptide (black [hatched] bars) in 4-week-old plants. Both wild-type (Col-0) and sid2-1 plant were infiltrated, and samples were taken at the indicated times. The average expression levels ± sd of the tested genes were scaled to 1 for t = 0 h. Data are from one representative experiment (n = 3).
Figure 9.
Figure 9.
Model for the Regulation of SA-Dependent Defense Responses by the Arabidopsis SUMO Paralogs SUM1, SUM2, and SUM3. (A) In noninfected plants, the SUM1 and SUM2 genes are constitutively expressed and the gene products inhibit (in a SIZ1-dependent manner) expression of SA-responsive defense genes, while expression levels of the SUM3 gene are low. (B) Recognition of a bacterial infection (e.g., by Flg22 perception) results in SA accumulation, which transiently induces SUM3 expression and induction of SA-responsive defense genes. Accumulation of SUM3 protein promotes plant defense. (C) The bacterial effector XopD from Xanthomonas is injected in host cell via the type three secretion system and inhibits plant defense gene expression via a transcriptional repressor domain. In addition, XopD contains a SUMO protease domain with SUMO protease activity toward SUM1- and SUM2-modified but also SUM3-modified proteins. Both biochemical activities (transcriptional repression and SUMO protease activity) result in enhanced virulence of bacteria expressing XopD.

Similar articles

Cited by

References

    1. Anckar J., Sistonen L. (2007). SUMO: Getting it on. Biochem. Soc. Trans. 35: 1409–1413 - PubMed
    1. Baurle I., Dean C. (2006). The timing of developmental transitions in plants. Cell 125: 655–664 - PubMed
    1. Bernier-Villamor V., Sampson D.A., Matunis M.J., Lima C.D. (2002). Structural basis for E2-mediated SUMO conjugation revealed by a complex between ubiquitin-conjugating enzyme Ubc9 and RanGAP1. Cell 108: 345–356 - PubMed
    1. Birnbaum K., Shasha D.E., Wang J.Y., Jung J.W., Lambert G.M., Galbraith D.W., Benfey P.N. (2003). A gene expression map of the Arabidopsis root. Science 302: 1956–1960 - PubMed
    1. Blomster H.A., Hietakangas V., Wu J., Kouvonen P., Hautaniemi S., Sistonen L. (2009). Novel proteomics strategy brings insight into the prevalence of SUMO-2 target sites. Mol. Cell. Proteomics 8: 1382–1390 - PMC - PubMed

Publication types

MeSH terms

LinkOut - more resources