. 2010 Aug;76(15):5269-77.
doi: 10.1128/AEM.00124-10. Epub 2010 Jun 4.

Host association of Campylobacter genotypes transcends geographic variation

Affiliations

Host association of Campylobacter genotypes transcends geographic variation

Samuel K Sheppard et al. Appl Environ Microbiol. 2010 Aug.

Abstract

Genetic attribution of bacterial genotypes has become a major tool in the investigation of the epidemiology of campylobacteriosis and has implicated retail chicken meat as the major source of human infection in several countries. To investigate the robustness of this approach to the provenance of the reference data sets used, a collection of 742 Campylobacter jejuni and 261 Campylobacter coli isolates obtained from United Kingdom-sourced chicken meat was established and typed by multilocus sequence typing. Comparative analyses of the data with those from other isolates sourced from a variety of host animals and countries were undertaken by genetic attribution, genealogical, and population genetic approaches. The genotypes from the United Kingdom data set were highly diverse, yet structured into sequence types, clonal complexes, and genealogical groups very similar to those seen in chicken isolates from the Netherlands, the United States, and Senegal, but more distinct from isolates obtained from ruminant, swine, and wild bird sources. Assignment analyses consistently grouped isolates from different host animal sources regardless of geographical source; these associations were more robust than geographic associations across isolates from three continents. We conclude that, notwithstanding the high diversity of these pathogens, there is a strong signal of association of multilocus genotypes with particular hosts, which is greater than the geographic signal. These findings are consistent with local and international transmission of host-associated lineages among food animal species and provide a foundation for further improvements in genetic attribution.


Figures
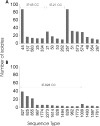
FIG. 1.
FIG. 1.
The most common C. jejuni (A) and C. coli (B) genotypes in United Kingdom retail poultry. Frequencies are determined for sequence types (STs) derived from seven-locus MLST, and the clonal complex (CC) is indicated where several of these STs are from a single clonal complex.
FIG. 2.
FIG. 2.
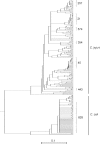
Genealogy of C. jejuni and C. coli isolates from United Kingdom retail poultry samples. The tree describes a genealogy estimated by ClonalFrame using 276 STs from 1,003 typed isolates. The positions of the most abundant clonal complexes (≥5 STs) in the data set are highlighted. The scale bar is in coalescent units.
FIG. 3.
FIG. 3.
Probabilistic assignment of published STs from chicken (A to D) and pig (E) isolates to host populations using the Bayesian clustering algorithm Structure. Each isolate is represented by a shaded vertical bar, showing the estimated probability that it comes from each of the putative sources. Chicken C. jejuni isolates from the Netherlands (A) and Senegal (B) were assigned among populations of C. jejuni isolates from retail poultry, ruminants (cattle and sheep), the environment, and wild birds. Chicken C. coli isolates from Senegal (C) were assigned among populations of chickens, cattle, pigs, and turkeys from the United States. Chicken C. coli isolates from the United States (D) were assigned among populations of cattle, pigs, and turkeys from the United States and retail poultry from the United Kingdom. Pig C. coli isolates from the United States (E) were assigned among populations of chickens, cattle, and turkeys from the United States and pig isolates from Europe.
FIG. 4.
FIG. 4.
FST trees based on 3,309-bp concatenated sequences of MLST genes from C. jejuni (A) and C. coli (B and C) showing genetic distance between the populations, structured by host and location of sampling, used in the Structure population genetic analysis. The scale bar is a measure of population differentiation by FST test, where 0 represents identical populations and 1 represents completely differentiated populations.
FIG. 5.
FIG. 5.
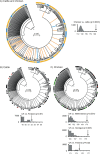
ClonalFrame genealogy of C. jejuni isolates from retail poultry and from published data sets showing association with chicken and ruminant hosts (A) and geographic location within cattle isolates (B) and chicken isolates (C). Host source is indicated in panel A by blue (ruminants), yellow (chickens), and open (both) circles. The countries of origin are indicated in panels B and C by black (United Kingdom), red (Finland), gray (Senegal), green (Netherlands), and open (multiple countries) circles. The colored branches leading to clades in panel A indicate that the clade contains isolates, corresponding to that color, from more than one country. The scale bars are in coalescent units. Histograms in each panel show the permutation test results for the association of clade with host (A) or geographic location (B and C). The arrows show the results from the data compared to frequency histograms of the scores from 10,000 permutations of the data which show the expected distribution of scores if no association exists.
FIG. 6.
FIG. 6.
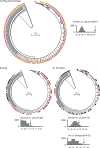
ClonalFrame genealogy of C. coli isolates from retail poultry and from published data sets showing association with chicken and pig hosts (A) and geographic location within pig isolates (B) and chicken isolates (C). Host source is indicated in panel A by pink (pigs), yellow (chickens), and open (both) circles. The countries of origin are indicated in panels B and C by black (United Kingdom), red (United States), gray (Senegal), green (Denmark), and open (multiple countries) circles. The colored branches leading to clades in panel A indicate that the clade contains isolates, corresponding to that color, from more than one country. The scale bars are in coalescent units. Histograms in each panel show the permutation test results for the association of clade with host (A) or geographic location (B and C). The arrows show the results from the data compared to frequency histograms of the scores from 10,000 permutations of the data which show the expected distribution of scores if no association exists.

Similar articles

Cited by

References

    1. Achtman, M. 2008. Evolution, population structure, and phylogeography of genetically monomorphic bacterial pathogens. Annu. Rev. Microbiol. 62:53-70. - PubMed
    1. Best, E. L., N. B. Powell, C. Swift, K. A. Grant, and J. A. Frost. 2003. Applicability of a rapid duplex real-time PCR assay for speciation of Campylobacter jejuni and Campylobacter coli directly from culture plates. FEMS Microbiol. Lett. 229:237-241. - PubMed
    1. Bolton, F. J., D. R. A. Wareing, M. B. Skirrow, and D. N. Hutchinson. 1992. Identification and biotyping of campylobacters, p. 151-161. In R. G. Board, D. Jones, and F. A. Skinner (ed.), Identification methods in applied and environmental microbiology. Blackwell Scientific Publications, Ltd., London, United Kingdom.
    1. Buzby, J. C., and T. Roberts. 1997. Economic costs and trade impacts of microbial foodbourne illness. World Health Stat. Q. 50:57-66. - PubMed
    1. Colles, F. M., T. A. Jones, N. D. McCarthy, S. K. Sheppard, A. J. Cody, K. E. Dingle, M. S. Dawkins, and M. C. Maiden. 2008. Campylobacter infection of broiler chickens in a free-range environment. Environ. Microbiol. 10:2042-2050. - PMC - PubMed

Publication types

MeSH terms