Comparative Study
. 2010 Aug;299(2):H454-69.
doi: 10.1152/ajpheart.00907.2009. Epub 2010 Jun 4.

Transmural heterogeneity of repolarization and Ca2+ handling in a model of mouse ventricular tissue

Affiliations
Comparative Study

Transmural heterogeneity of repolarization and Ca2+ handling in a model of mouse ventricular tissue

Vladimir E Bondarenko et al. Am J Physiol Heart Circ Physiol. 2010 Aug.

Abstract

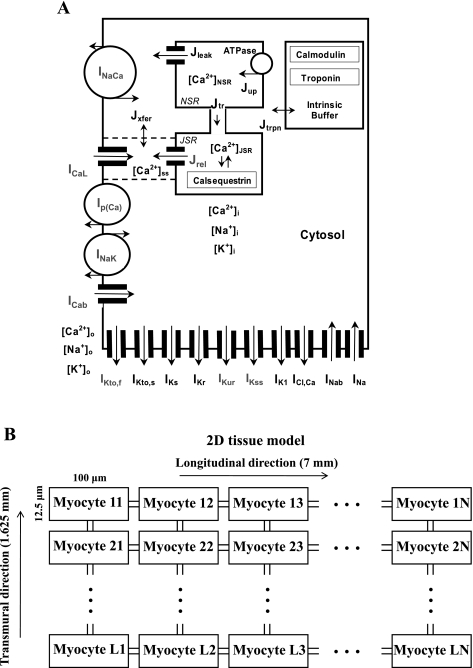
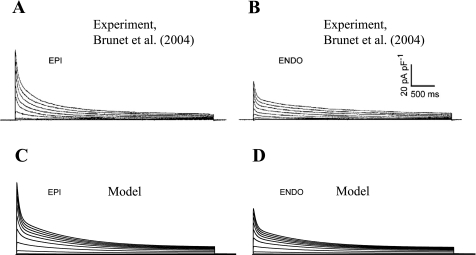
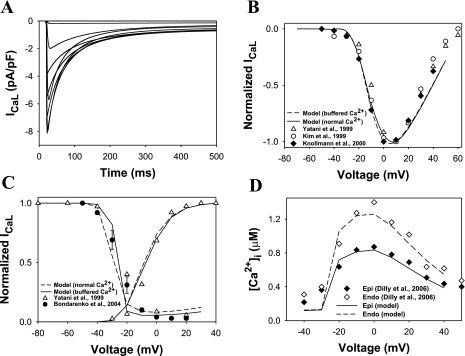
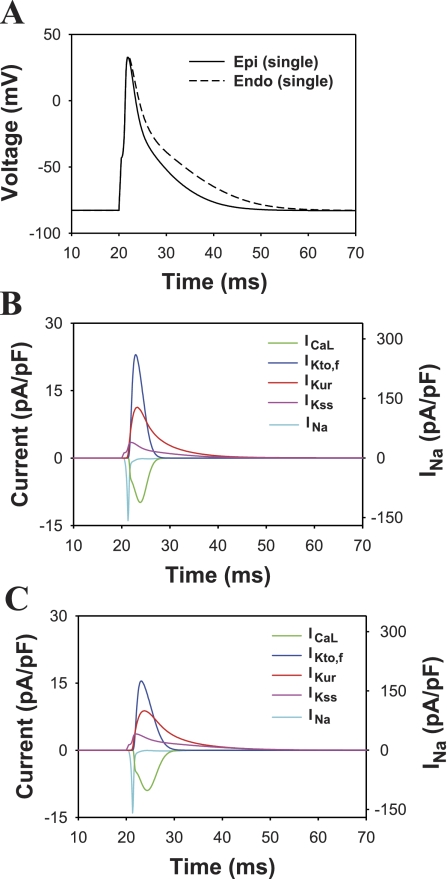
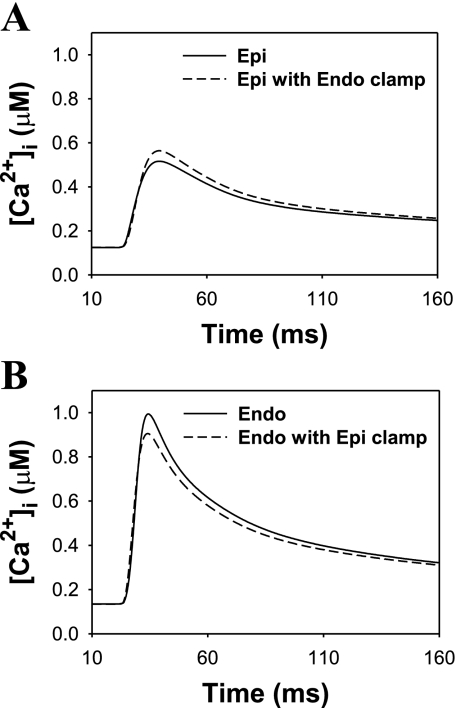
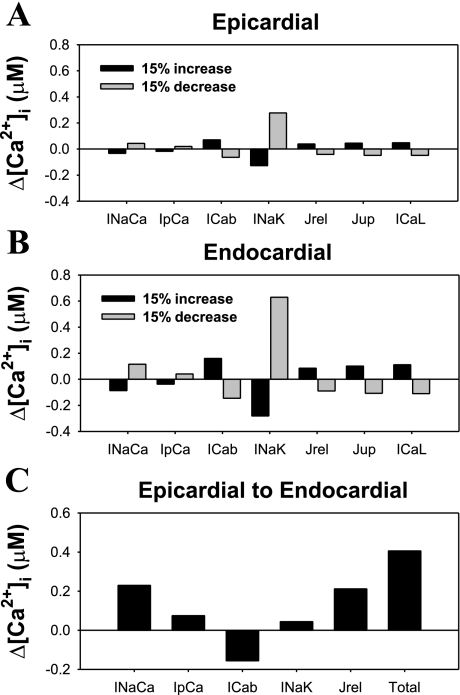
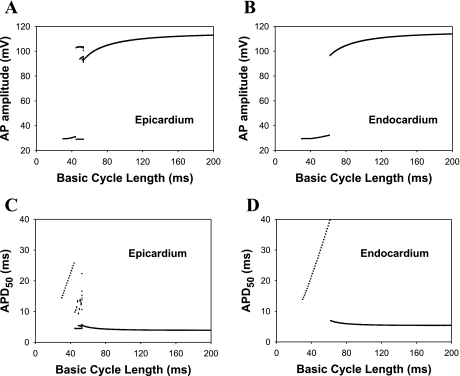
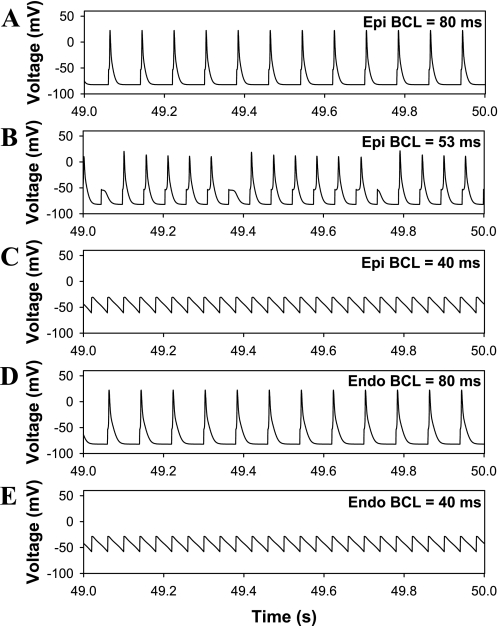
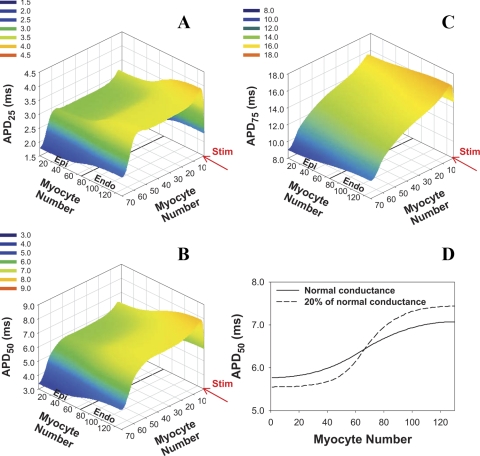
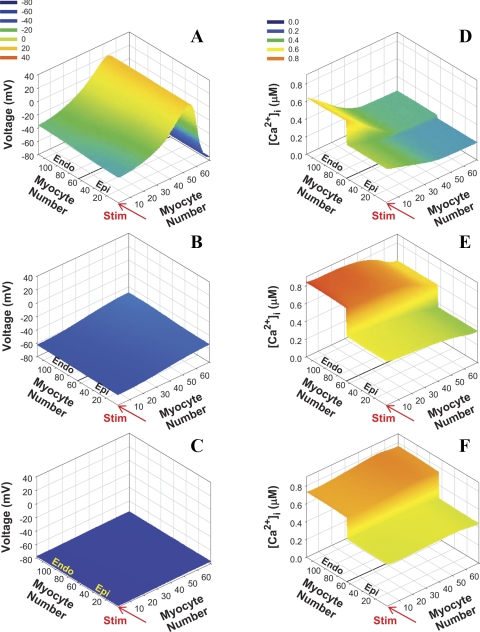
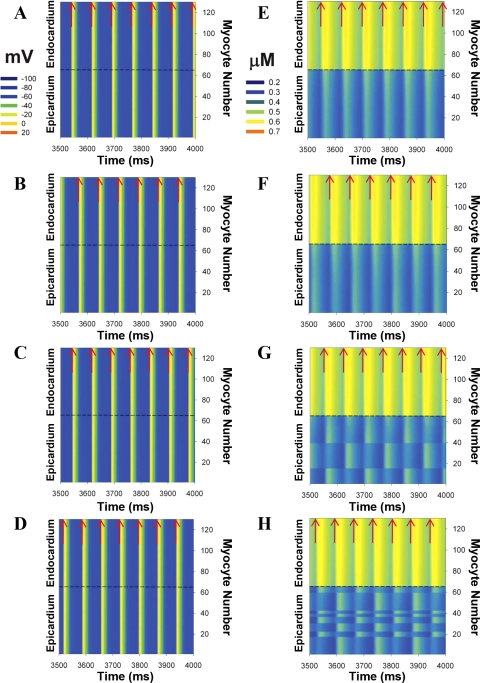
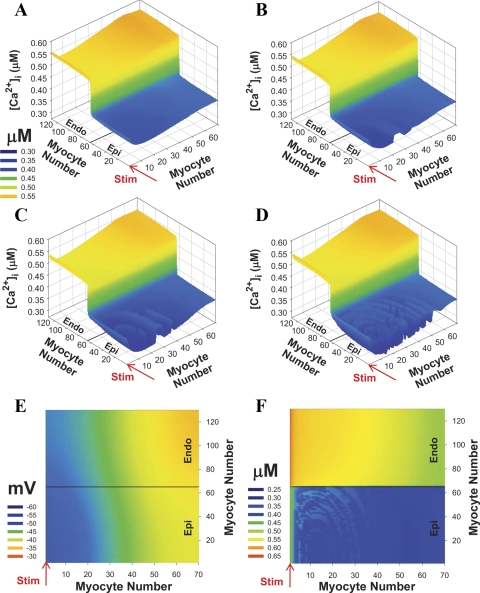
Mouse hearts have a diversity of action potentials (APs) generated by the cardiac myocytes from different regions. Recent evidence shows that cells from the epicardial and endocardial regions of the mouse ventricle have a diversity in Ca(2+) handling properties as well as K(+) current expression. To examine the mechanisms of AP generation, propagation, and stability in transmurally heterogeneous tissue, we developed a comprehensive model of the mouse cardiac cells from the epicardial and endocardial regions of the heart. Our computer model simulates the following differences between epicardial and endocardial myocytes: 1) AP duration is longer in endocardial and shorter in epicardial myocytes, 2) diastolic and systolic intracellular Ca(2+) concentration and intracellular Ca(2+) concentration transients are higher in paced endocardial and lower in epicardial myocytes, 3) Ca(2+) release rate is about two times larger in endocardial than in epicardial myocytes, and 4) Na(+)/Ca(2+) exchanger rate is greater in epicardial than in endocardial myocytes. Isolated epicardial cells showed a higher threshold for stability of AP generation but more complex patterns of AP duration at fast pacing rates. AP propagation velocities in the model of two-dimensional tissue are close to those measured experimentally. Simulations show that heterogeneity of repolarization and Ca(2+) handling are sustained across the mouse ventricular wall. Stability analysis of AP propagation in the two-dimensional model showed the generation of Ca(2+) alternans and more complex transmurally heterogeneous irregular structures of repolarization and intracellular Ca(2+) transients at fast pacing rates.


Figures

Fig. 1.
Fig. 1.
A: schematic diagram of the mouse model ionic currents and Ca2+ fluxes. Transmembrane currents are as follows: the fast Na+ current (INa), the L-type Ca2+ current (ICaL), the sarcolemmal Ca2+ pump [Ip(Ca)], the Na+/Ca2+ exchanger (INaCa), the rapidly recovering transient outward K+ current (IKto,f), the slowly recovering transient outward K+ current (IKto,s), the rapid delayed-rectifier K+ current (IKr), the ultrarapidly activating delayed-rectifier K+ current (IKur), the noninactivating steady-state voltage-activated K+ current (IKss), the time-independent K+ current (IK1), the slow delayed-rectifier K+ current (IKs), the Na+-K+ pump (INaK), the Ca2+-activated chloride current (ICl,Ca), and the Ca2+ and Na+ background currents (ICab and INab, respectively). Istim, external stimulation current; NSR, network sarcoplasmic reticulum; JSR, junctional sarcoplasmic reticulum; [Ca2+]i, [Na+]i, and [K+]i, intracellular Ca2+, Na+, and K+ concentrations, respectively; [Ca2+]o, [Na+]o, and [K+]o, extracellular Ca2+, Na+, and K+ concentrations, respectively. The Ca2+ fluxes within the cell are as follows: uptake Ca2+ from the cytosol to the network sarcoplasmic reticulum (SR) (Jup), Ca2+ release from the junctional SR (Jrel), Ca2+ flux from the network to junctional SR (Jtr), Ca2+ leak from the SR to the cytosol (Jleak), Ca2+ flux from the subspace volume to the bulk myoplasm (Jxfer), and Ca2+ flux to troponin (Jtrpn). The model includes Ca2+ buffering by troponin and calmodulin in the cytosol and by calsequestrin in the SR. Current systems changed from the apex/septum model of Bondarenko et al. (6) are shaded gray. B: geometry of two-dimensional (2-D) multicellular tissue used in this study. The transmural 2-D model tissue consists of 9,100 mouse ventricular myocytes, a rectangular sheet of 130 myocytes × 70 myocytes (L = 130, N = 70), which is equivalent to the rectangle with 7 mm length and 1.625 mm width.
Fig. 2.
Fig. 2.
Total depolarization-activated K+ currents from different regions of mouse heart. A and B: epicardial (Epi) and endocardial (Endo) whole cell currents from Ref. . C and D: simulated currents from the model epicardial and endocardial cells. Experimental currents were recorded in response to 4.5-s voltage steps to test potential between −40 and +40 mV from holding potential of −70 mV. Simulated currents were elicited by a 4.5-s depolarizing step to between −70 and +50 mV in 10-mV increments from a holding potential of −70 mV.
Fig. 3.
Fig. 3.
ICaL and [Ca2+]i transients. A: a family of simulated current traces. A 5-s depolarizing first pulse (P1) to between −70 and +40 mV (in 10-mV increments) was applied from a holding potential of −80 mV. This was followed by a second 500-ms pulse to +10 mV. For clarity, only first 500 ms are shown. Raw current simulations were performed to match the experimental conditions of Masaki et al. (41) and Yatani et al. (75) in which [Ca2+]i was buffered with 5 mM EGTA (BAPTA) and SR was depleted with 10 μM ryanodine (no Ca2+ release). Simulated inactivation time constants at +20 mV τf = 27.1 ms (Af = 42.3%) and τs = 96.7 ms (Af = 57.7%) were similar to the experimental values from Ref. τf = 26.1 ± 2.7 ms (Af = 54.4 ± 11.3%) and τs = 96.1 ± 18.8 ms (Af = 45.6 ± 11.3%). B: Peak ICaL current-voltage relationships for simulated and experimental data. The solid line shows data from simulations under normal physiological extracellular ion concentrations, and the dashed line connects data simulating the experimental conditions of Yatani et al. (75). Experimental results are shown by white circles (31), white triangles (75), and black diamonds (33). C: normalized channel conductance G/Gmax and steady-state inactivation relationships for 500-ms P1 pulse simulations (dashed lines) and 5-s P1 pulse simulations with buffered Ca2+ (solid lines). Black circles are our data from 5-s P1 pulses and [Ca2+]i buffered with 5 mM EGTA (6). White triangles are from the experimental measurements of Yatani et al. (75) where Ca2+ was buffered with 5–10 mM EGTA (BAPTA). D: voltage dependence of simulated (solid and dashed lines for endocardial and epicardial cells, respectively) and experimental [black and white diamonds for endocardial and epicardial cells, respectively (18)] [Ca2+]i.
Fig. 4.
Fig. 4.
Simulated action potentials (APs) and underlying currents of the mouse ventricular myocyte model. A: the epicardial (solid line) and endocardial (dashed line) APs. B: currents underlying the epicardial AP. C: currents underlying the endocardial AP. The scale for the relatively large INa is given on the right-hand axis in B and C. All other currents are scaled to the left axis. Pacing frequency was 1 Hz. APs and ionic currents are shown for the 10th stimulation basic cycle length (BCL).
Fig. 5.
Fig. 5.
Simulated intracellular Ca2+ transients for the epicardial (A) and endocardial (B) cells. Pacing frequency was 1 Hz. A: [Ca2+]i transients in epicardial cell induced by epicardial AP (solid line) and by endocardial AP clamp (dashed line). B: [Ca2+]i transients in endocardial cell induced by endocardial AP (solid line) and by epicardial AP clamp (dashed line). The data show the contribution of AP shape into differences between [Ca2+]i transients in epicardial and endocardial cells.
Fig. 6.
Fig. 6.
Sensitivity analysis of epicardial and endocardial model cells and contribution of key elements of Ca2+ handling system to differences in [Ca2+]i transients in epicardial and endocardial myocytes. A: changes in the amplitude of [Ca2+]i transients (Δ[Ca2+]i) in response to a 15% increase (black bars) or a 15% decrease (gray bars) of the indicated current or Ca2+ flux for epicardial cell. B: same as in A for endocardial cell. C: changes in the amplitude of [Ca2+]i transients in epicardial model cell when the indicated model current (Ca2+ flux) changed its value to that corresponding to the endocardial model cell. Total increase in the amplitude of [Ca2+]i transient (“Total” bar) is close to the sum of partial contributions from the currents and a flux changed.
Fig. 7.
Fig. 7.
Simulated frequency dependence (bifurcation diagrams) of AP amplitude (A and B) and AP duration (APD) at 50% of repolarization (APD50; C and D) for epicardial (A and C) and endocardial (B and D) ventricular myocytes. BCL as a bifurcation parameter was varied from 30 to 200 ms. The bifurcation diagrams for epicardial cells show complex behavior when the pacing frequency increases.
Fig. 8.
Fig. 8.
Simulated APs: expansions of the action potentials corresponding to critical regions of Fig. 7. A–C: epicardial myocytes. D and E: endocardial myocytes. A and D: BCL = 80 ms. C and E: BCL = 40 ms. B: irregular APs from epicardial cells stimulated with a BCL of 53 ms.
Fig. 9.
Fig. 9.
APDs in 2-D model of transmurally heterogeneous tissue. Model tissue consists of 9,100 cells (130 columns, 70 cells in each column), 65 columns contain epicardial cells (columns 1–65), and 65 columns contain endocardial cells (columns 66–130). Stimulus (Istim = 900 pA/pF, τstim = 0.5 ms, shown by red arrow) is applied for the first row with pacing frequency of 4 Hz. APDs were determined after 16 stimuli. A: APD at 25% of repolarization (APD25). B: APD50. C: APD at 75% of repolarization (APD75). D: transmural distribution of APD50 in row 35 of the 2-D tissue with normal intercellular conductances (ggap,l = 25 nS/pF, ggap,tr = 500 nS/pF, solid line) and with intercellular conductances reduced by factor 5 (dashed line).
Fig. 10.
Fig. 10.
2-D plots of APs and [Ca2+]i transients in transmurally heterogeneous model tissue with normal conductances at different times after the stimulation was applied. Stimulation (Istim = 900 pA/pF, τstim = 0.5 ms) is applied to the first row with pacing frequency 4 Hz (shown by red arrows). Data are shown for 16th stimulus. A–C: APs. D–F: [Ca2+]i transients. A and D: 10 ms after stimulus. B and E: 20 ms after stimulus. C and F: 30 ms after stimulus. Note that all cells show maximal [Ca2+]i transients in the whole tissue simultaneously (F).
Fig. 11.
Fig. 11.
Spatiotemporal organization of APs (A–D) and [Ca2+]i transients (E–H) in row 35 of 2-D model of the mouse inhomogeneous multicellular cardiac tissue, consisting of 65 epicardial and 65 endocardial myocytes. Stimulus currents (Istim = 900 pA/pF, τstim = 0.5 ms) were applied at pacing periods of 75 (A and E), 74 (B and F), 72 (C and G), and 70 (D and H) ms to row 1. Red arrows show time moments at which stimuli were applied. Intercellular connection strengths ggap,x = 500 nS/pF and ggap,y = 25 nS/pF in transmural and longitudinal directions, respectively.
Fig. 12.
Fig. 12.
[Ca2+]i transient alternans in transmurally heterogeneous 2-D model tissue with normal conductances at different BCLs. Stimulation (Istim = 900 pA/pF, τstim = 0.5 ms) is applied for the first row (shown by red arrows). A–D: three-dimensional view of [Ca2+]i transient alternans at 40 ms after stimulus was applied. A: BCL = 76 ms. B: BCL = 74 ms. C: BCL = 72 ms. D: BCL = 70 ms. E and F: 2-D view of AP and [Ca2+]i transients at BCL = 70 ms and at 20 ms after stimulus was applied. Data are obtained after at least 50 stimuli.

References

    1. Antzelevitch C, Shimizu W. Cellular mechanisms underlying the long QT syndrome. Curr Opin Cardiol 17: 43–51, 2002 - PubMed
    1. Anumonwo JM, Tallini YN, Vetter FJ, Jalife J. Action potential characteristics and arrhythmogenic properties of the cardiac conduction system of the murine heart. Circ Res 89: 329–335, 2001 - PubMed
    1. Bondarenko VE, Rasmusson RL. Re-entry in a multicellular model of mouse ventricle (Abstract). Biophys J 90: 547A, 2006
    1. Bondarenko VE, Rasmusson RL. Simulations of propagated mouse ventricular action potentials: effects of molecular heterogeneity. Am J Physiol Heart Circ Physiol 293: H1816–H1832, 2007 - PubMed
    1. Bondarenko VE, Rasmusson RL. Suppression of cellular alternans in guinea pig ventricular myocytes with LQT2: insights from the Luo-Rudy model. Int J Bifurcat Chaos 17: 381–425, 2007

Publication types

LinkOut - more resources