. 2010 Aug;299(2):H482-91.
doi: 10.1152/ajpheart.00756.2009. Epub 2010 Jun 4.

Functional anatomy of the murine sinus node: high-resolution optical mapping of ankyrin-B heterozygous mice

Affiliations

Functional anatomy of the murine sinus node: high-resolution optical mapping of ankyrin-B heterozygous mice

Alexey V Glukhov et al. Am J Physiol Heart Circ Physiol. 2010 Aug.

Abstract

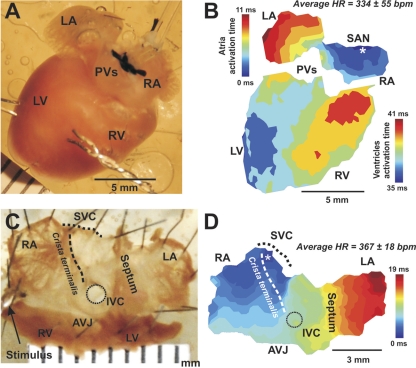
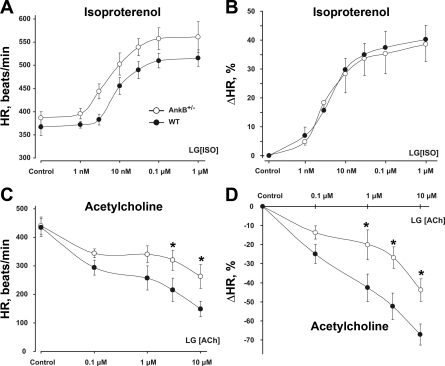
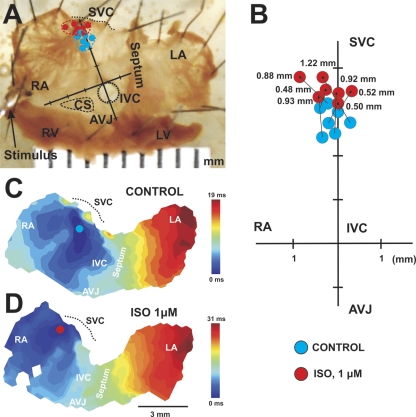
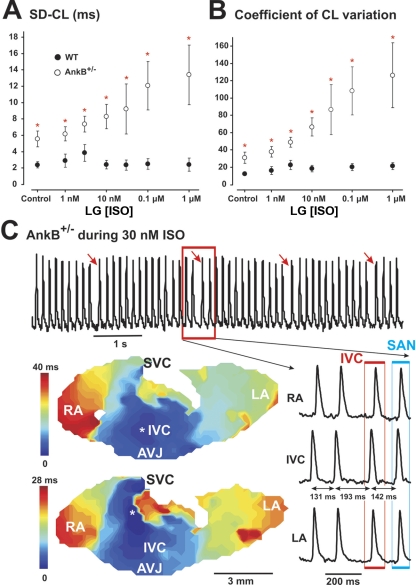
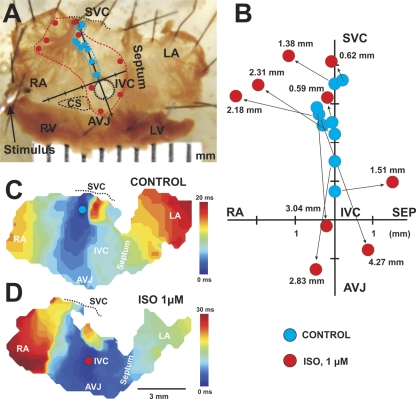
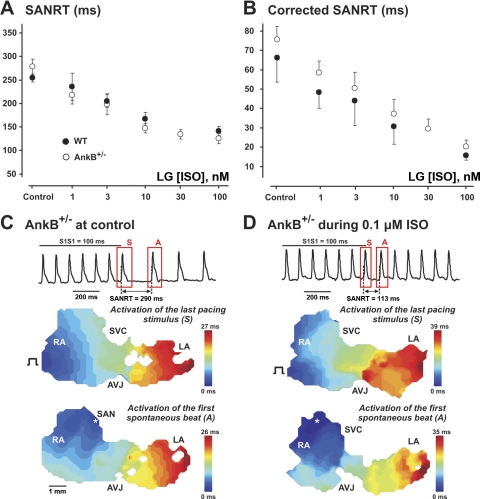
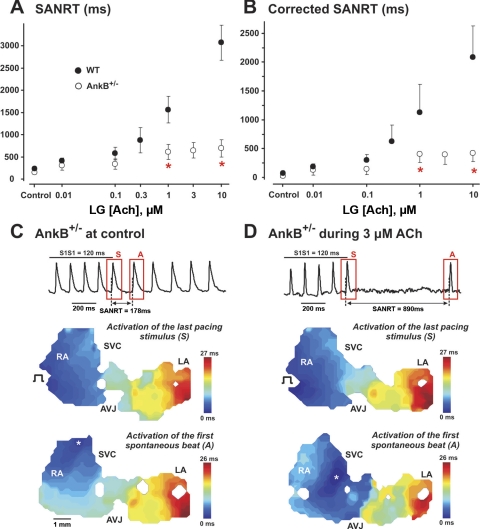
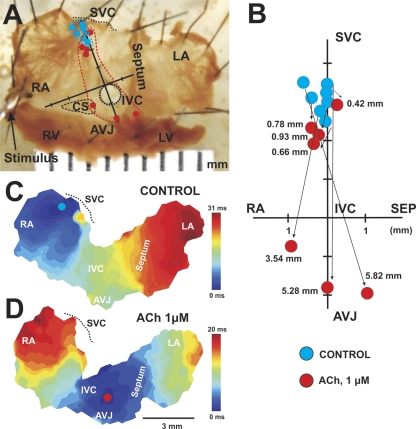
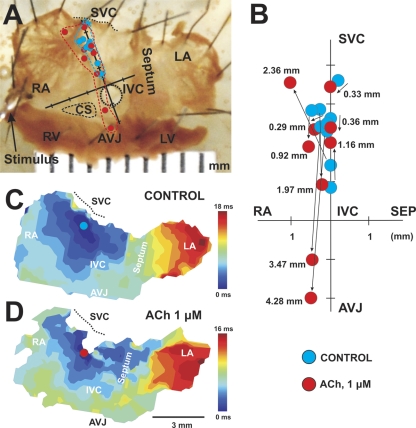
The mouse is widely used as a genetic platform to investigate the molecular mechanisms of sinoatrial node (SAN) pacemaking. Recently, it has been shown that isolated SAN cells from the ankyrin-B (AnkB)-deficient mice display severe pacemaking dysfunction similar to individuals harboring ankyrin 2 allele variants. However, these results have been limited to isolated SAN cells only and thus did not evaluate the functional anatomy of the widely distributed atrial pacemaker complex (e.g., the dynamic interaction of primary and subsidiary pacemakers). We studied pacemaker function in an intact mouse atrial preparation, which included the SAN, atrioventricular junction (AVJ), and both atria, excluding most of the septum. Optical mapping with a voltage-sensitive dye and CMOS camera ULTIMA-L was used to map spontaneous pacemaker activity with or without autonomic modulation in wild-type (WT) mice (n = 7) and in the AnkB heterozygous (AnkB(+/-); n = 9) mouse model of human SAN disease. In WT mice, isoproterenol accelerated the SAN rate (for 10 microM: from 325 + or - 19 to 510 + or - 33 beat/min, P < 0.01) and shifted the leading pacemaker site superiorly by 0.77 + or - 0.11 mm within the SAN. ACh decreased the SAN rate (from 333 + or - 26 to 96 + or - 22 beats/min, P < 0.01) and shifted the leading pacemaker either inferiorly within the SAN or abruptly toward the AVJ. After isoproterenol, AnkB(+/-) mice exhibited a larger beat-to-beat variability (SD of a cycle length: 13.4 + or - 3.6 vs. 2.5 + or - 0.8 ms, P < 0.01 vs. WT mice), disorganized shift of the leading pacemaker (2.04 + or - 0.37 mm, P < 0.05 vs. WT mice), and competing multiple pacemakers, resulting in beat-to-beat changes of the leading pacemaker location site between the SAN and AVJ regions. Notably, AnkB(+/-) mice also displayed a reduced sensitivity to ACh (rate slowing by 32 + or - 12% vs. 67 + or - 4%, P < 0.05, AnkB(+/-) vs. WT mice, respectively). In conclusion, AnkB dysfunction results in SAN abnormalities in an isolated mouse atria preparation. While AnkB dysfunction dramatically alters single SAN cell function, the mechanisms underlying cardiac automaticity are clearly complex, and phenotypes may be partially compensated by the dynamic interaction of cells within the pacemaker complex. These new findings highlight the importance of the functional anatomy of the entire atrial distributed pacemaker complex, including the SAN and AVJ, and clearly demonstrate the role of AnkB in cardiac automaticity.


Figures

Fig. 1.
Fig. 1.
Optical mapping of spontaneous pacemaker activity. A: photograph of the posterior surface of an isolated Langendorff-perfused mouse heart during a typical experiment. LA, left atrium; RA, right atrium; PVs, pulmonary veins; LV, left ventricle; RV, right ventricle. B: typical example of activation maps from both atria and ventricles during spontaneous sinus rhythm. Two color time scales for atrial and ventricular activation are shown with 34 ms of atrioventricular (AV) delay between the end of atrial activation and the beginning of ventricular activation. *Origin of activation. HR, heart rate [in beats/min (bpm)]; SAN, sinoatrial node. To better define the location of the primary pacemaker, isolated atria preparations were mapped (C). The preparation was oriented so that the RA was on the left side of the image. Anatomical features [the superior (SVC) and inferior vena cava (IVC) and crista terminalis] are marked by dashed lines. AVJ, AV junstion. D: activation map of the isolated mouse atria preparation during spontaneous rhythm. The average HR was not significantly changed after the isolation of the atria.
Fig. 2.
Fig. 2.
Autonomic modulation of spontaneous atrial rhythm. A and C: dose-dependent effects of isoproterenol (Iso; A) and ACh (C) on the spontaneous rhythm (HR; in beats/min) of the isolated mouse atria preparation. B and D: relative changes (in percentages of control values) of atrial rhythm with Iso (B) and ACh (D). AnkB+/−, ankyrin-B (AnkB) heterozygous mice; WT, wild-type mice. *P < 0.05 compared with AnkB+/− mice.
Fig. 3.
Fig. 3.
Effect of sympathetic stimulation on the maximum shift of the leading pacemaker in WT mice. A: photograph of a typical preparation consisting of an isolated adult mouse RA and LA. The orthogonal axes were used to plot locations of the leading pacemaker site. The axes are plotted so that they cross at the IVC; the superior to inferior direction (from the SVC to the AVJ through the IVC) is along the ordinate and the lateral to mediate direction (from the RA to the LA through the septum) is along the abscissa. The location of the leading pacemaker is shown by circles (blue circles for control conditions and red circles for 1 μM Iso perfusion). CS, coronary sinus. B: enlarged illustration of the pacemaker distribution. The distance of maximum pacemaker shift (shown by arrow) was calculated for each preparation (in mm). C and D: representative examples of atrial activation under control conditions (C) and during 1 μM Iso perfusion (D). Abbreviations are the same as those in Fig. 1.
Fig. 4.
Fig. 4.
SAN dysfunction in AnkB+/− mice. A: SD of a cycle length (SD-CL; in ms) during spontaneous beating in the isolated atria of WT and AnkB+/− mice. B: coefficient of variation of a cycle length. C: beat-to-beat competition (labeled by red arrows) between the primary and secondary pacemakers in AnkB+/− mouse atria in response to sympathetic stimulation (30 nM Iso). Top, the red rectangle shows a fragment of recording where shift of a leading pacemaker appeared. This example is demonstrated in detail in the bottom. The two color contour maps represent the activation patterns during location of the leading pacemaker in both IVC (top) and SAN (bottom) regions. The two color scales show the corresponding activation time for each map. Optical recordings from different sites of preparation (marked by numbers) are shown beside the maps. The red and blue rectangles show the activation from the IVC and SAN, correspondingly. Abbreviations are the same as those in Fig. 1. *P < 0.05 compared with AnkB+/− mice.
Fig. 5.
Fig. 5.
Effect of sympathetic stimulation on the maximum shift of the leading pacemaker in AnkB+/− mice. A: photograph of a typical preparation consisting of isolated adult mouse RA and LA. The orthogonal axes are the same as those in Fig. 3. The location of the leading pacemaker is shown by circles (blue circles for control conditions and red circles for 1 μM Iso perfusion). B: enlarged illustration of the pacemaker distribution. The distance of maximum pacemaker shift (shown by arrow) was calculated for each preparation (in mm). SEP, septum. C and D: representative examples of atrial activation under control conditions (C) and during 1 μM Iso perfusion (D). Abbreviations are the same as those in Fig. 1.
Fig. 6.
Fig. 6.
SAN recovery time (SANRT) during sympathetic stimulation. A and B: dose-dependent changes of SANRT (A) and corrected SANRT (B) during Iso perfusion in WT and AnkB+/− mice. C and D: representative examples of atria activation during SANRT measurements under control conditions (C) and during 1 μM Iso perfusion (D) for AnkB+/− mice. Abbreviations are the same as those in Fig. 1.
Fig. 7.
Fig. 7.
SANRT during parasympathetic stimulation. A and B: dose-dependent changes of SANRT (A) and corrected SANRT (B) during ACh perfusion in WT and AnkB+/− mice. C and D: representative examples of atria activation during SANRT measurements under control conditions (C) and during 3 μM ACh perfusion (D) for AnkB+/− mice. Abbreviations are the same as those in Fig. 1. *P < 0.05 compared with WT mice.
Fig. 8.
Fig. 8.
Effect of parasympathetic stimulation on the maximum shift of the leading pacemaker in WT mice. A: photograph of a typical preparation consisting of isolated adult mouse RA and LA. The orthogonal axes are the same as those in Fig. 3. The location of the leading pacemaker is shown by circles (blue circles for control conditions and red circles for 1 μM ACh perfusion). B: enlarged illustration of pacemaker distribution. C and D: representative examples of atrial activation under control conditions (C) and during 1 μM ACh perfusion (D). Abbreviations are the same as those in Fig. 1.
Fig. 9.
Fig. 9.
Effect of parasympathetic stimulation on the maximum shift of the leading pacemaker in AnkB+/− mice. A: photograph of a typical preparation consisting of isolated adult mouse RA and LA. The orthogonal axes are the same as in Fig. 3. The location of the leading pacemaker is indicated by circles (blue circles for control conditions and red circles for 1 μM ACh perfusion). B: enlarged illustration of pacemaker distribution. C and D: representative examples of atrial activation under control conditions (C) and during 1 μM ACh perfusion (D). Abbreviations are the same as those in Fig. 1.

Similar articles

Cited by

References

    1. Adan V, Crown LA. Diagnosis and treatment of sick sinus syndrome. Am Fam Physician 67: 1725–1732, 2003 - PubMed
    1. Baker LC, Wolk R, Choi BR, Watkins S, Plan P, Shah A, Salama G. Effects of mechanical uncouplers, diacetyl monoxime, and cytochalasin-D on the electrophysiology of perfused mouse hearts. Am J Physiol Heart Circ Physiol 287: H1771–H1779, 2004 - PubMed
    1. Beau SL, Hand DE, Schuessler RB, Bromberg BI, Kwon B, Boineau JP, Saffitz JE. Relative densities of muscarinic cholinergic and beta-adrenergic receptors in the canine sinoatrial node and their relation to sites of pacemaker activity. Circ Res 77: 957–963, 1995 - PubMed
    1. Benditt D, Sakaguchi S, Goldstein M, Lurie K, Gornick C. Sinus node dysfunction: pathophysiology, clinical features, evaluation, and treatment. In: Cardiac Electrophysiology: From Cell to Bedside, edited by Zipes DP, Jalife J. Philadelphia, PA: Saunders, 1995, p. 1215–1247
    1. Bennett V, Baines AJ. Spectrin and ankyrin-based pathways: metazoan inventions for integrating cells into tissues. Physiol Rev 81: 1353–1392, 2001 - PubMed

Publication types

MeSH terms

LinkOut - more resources