

doi: 10.1074/mcp.R000007-MCP201.
Epub 2010 Jun 4.
Computational tools for the interactive exploration of proteomic and structural data
Affiliations
- PMID: 20525940
- PMCID: PMC2938059
- DOI: 10.1074/mcp.R000007-MCP201
Item in Clipboard
Computational tools for the interactive exploration of proteomic and structural data
Mol Cell Proteomics.
2010 Aug.
Abstract
Linking proteomics and structural data is critical to our understanding of cellular processes, and interactive exploration of these complementary data sets can be extremely valuable for developing or confirming hypotheses in silico. However, few computational tools facilitate linking these types of data interactively. In addition, the tools that do exist are neither well understood nor widely used by the proteomics or structural biology communities. We briefly describe several relevant tools, and then, using three scenarios, we present in depth two tools for the integrated exploration of proteomics and structural data.
Figures

TCGA mRNA expression data. This screenshot of the clusterMaker hierarchical cluster results shows the mRNA expression data across all tumors in the TCGA study and all genes in the TCGA GBM pathway.

TCGA copy number variation data. This heat map shows the copy number variations for genes in the TCGA glioblastoma pathway across all of the tumors. The colors indicate the copy number variation noted: bright blue, homozygous deletion; blue, hemizygous deletion; black, no variation; gray, not measured; yellow, gain; bright yellow, high level amplification.
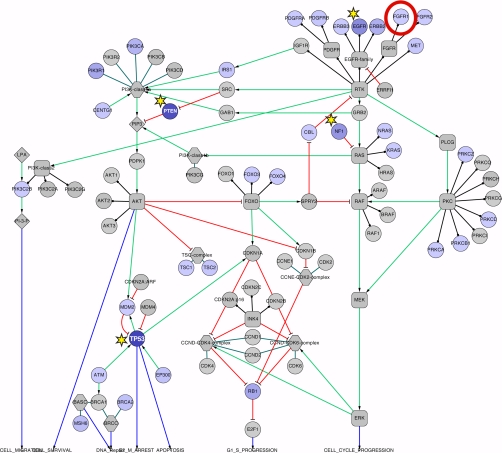
TCGA glioblastoma pathway. This Cytoscape export of the TCGA glioblastoma pathway shows the protein nodes colored by the percentage of the 91 sequenced tumors that showed mutations for that protein. Protein nodes with yellow stars indicate the most highly mutated nodes. The node in the red circle (FGFR1) is the protein studied for scenario 1.

Superimposed structures of FGFR1 kinase domain. The backbones are shown as “licorice” ribbons, and the side chains of interest are shown as sticks. pY, phosphotyrosine. Heteroatoms are colored by element: oxygen, red; nitrogen, blue; phosphorus, orange. The activated structure (PDB code 3gqi , chain A) is shown in turquoise with black labels; in this conformation, the Lys-656 side chain (yellow carbons) is H-bonded to phospho-Tyr-654 as indicated by the red dashed line. The activated structure also includes an ATP analog, displayed here in the space-filling representation. The inactive conformation (PDB code 3c4f , chain A) is shown with a transparent purple backbone and purple labels. (The purple dashed line indicates structure information missing from the PDB file.) In the inactive conformation, the Lys-656 side chain (pink carbons) is not forming any intramolecular H-bonds. The Chimera command file for setting up this image is available as supplemental Data 2 . The commands in the file set up everything except the orientation and labels, which although scriptable are normally generated interactively.

Wild-type and mutant IDH1 structures. The wild-type structure (PDB code 1t01 , chain D) is shown on the left, with the substrate isocitrate, cofactor NADP (both dark green with heteroatom color coding as in Fig. 5), and a calcium ion (purple) bound in the active site. Dashed red lines show H-bonds between Arg-132 and isocitrate identified with the FindHBond extension in Chimera. The inset at right shows the mutated protein (PDB code 3inm , chain A) in which residue 132 is a histidine, with isocitrate and the other bound ligands modeled into the structure based on the MatchMaker superposition with the wild-type structure. In this modeled complex, the His-132 side chain is too far from the isocitrate to H-bond with it, as assessed by FindHBond.

2HG similarity. A portion of the chembl network (A) shows significant hits from a SEA search for 2-hydroxyglutarate (B). Nodes are proteins with known ligands that match the structure of 2-hydroxyglutarate, and the edges represent the similarity between the ligands known to bind to the proteins. The table (C) was generated with the chemViz Cytoscape plug-in and shows a portion of the compounds known to target the protein with UniProt accession number Q9Y3Q0 (the text has been expanded for clarity).

Collins et al. (65) protein-protein interaction data. A hierarchical clustering of the Collins et al. (65) protein-protein interaction network for S. cerevisiae is shown. Inset A, in the lower left is the non-clustered protein-protein interaction network with the nodes colored by the GO annotation for biological function. Inset B shows a close-up of the cluster for RNA polymerase II.

MCL clustering results. The results of applying MCL clustering to the Collins et al. (65) protein-protein interaction data set are shown. The inset shows the cluster associated with RNA polymerase II. The nodes in yellow correspond to the group indicated from the hierarchical clustering.

Cytoscape and Chimera views of RNA polymerase II. The nine subunits of RNA polymerase II in the Collins et al. (65) protein-protein interaction data set are shown with the node colors randomly assigned. The structure has been opened with the structureViz Cytoscape plug-in (23), and the colors of the individual chains have been colored to match the node colors. The colors of RPB1, RPB6, and RPB12 have been set to dark gray, gray, and white, respectively.

Yeast RNA polymerase II with human RPB4-RPB7 fit. The yeast RNA polymerase II structure fit into a cryoelectron microscopy map of the human complex is shown. The stalk structures (in the blue square) are human RPB4-RPB7 that have been placed by aligning them with the homologous yeast structures using the MatchMaker tool in Chimera. See the Chimera tutorial on density maps (online at the Chimera web site) for instructions on how to duplicate this figure.
References
-
- Kühner S., van Noort V., Betts M. J., Leo-Macias A., Batisse C., Rode M., Yamada T., Maier T., Bader S., Beltran-Alvarez P., Castaño-Diez D., Chen W. H., Devos D., Güell M., Norambuena T., Racke I., Rybin V., Schmidt A., Yus E., Aebersold R., Herrmann R., Böttcher B., Frangakis A. S., Russell R. B., Serrano L., Bork P., Gavin A. C. (2009) Proteome organization in a genome-reduced bacterium. Science 326, 1235–1240 - PubMed
-
- Kim P. M., Lu L. J., Xia Y., Gerstein M. B. (2006) Relating three-dimensional structures to protein networks provides evolutionary insights. Science 314, 1938–1941 - PubMed
-
- Han B. G., Dong M., Liu H., Camp L., Geller J., Singer M., Hazen T. C., Choi M., Witkowska H. E., Ball D. A., Typke D., Downing K. H., Shatsky M., Brenner S. E., Chandonia J. M., Biggin M. D., Glaeser R. M. (2009) Survey of large protein complexes in D. vulgaris reveals great structural diversity. Proc. Natl. Acad. Sci. U.S.A. 106, 16580–16585 - PMC - PubMed
Publication types
MeSH terms
Substances
Grants and funding
LinkOut - more resources
Full Text Sources
Molecular Biology Databases
