

The SILAC fly allows for accurate protein quantification in vivo
- PMID: 20525996
- PMCID: PMC2953914
- DOI: 10.1074/mcp.M110.000323
The SILAC fly allows for accurate protein quantification in vivo
Abstract
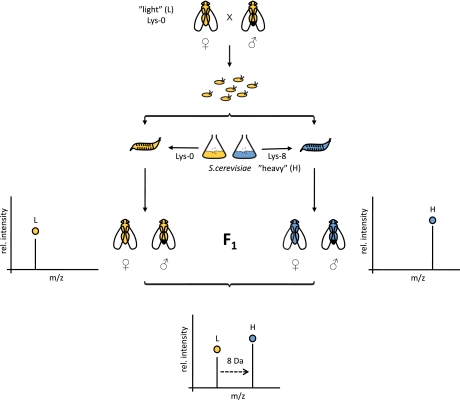
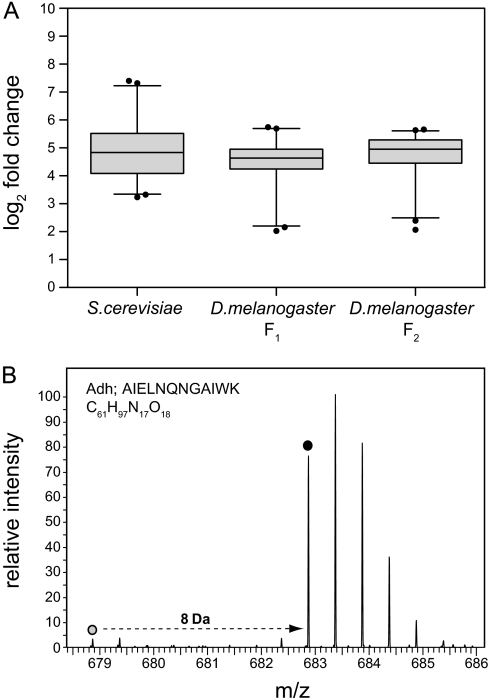
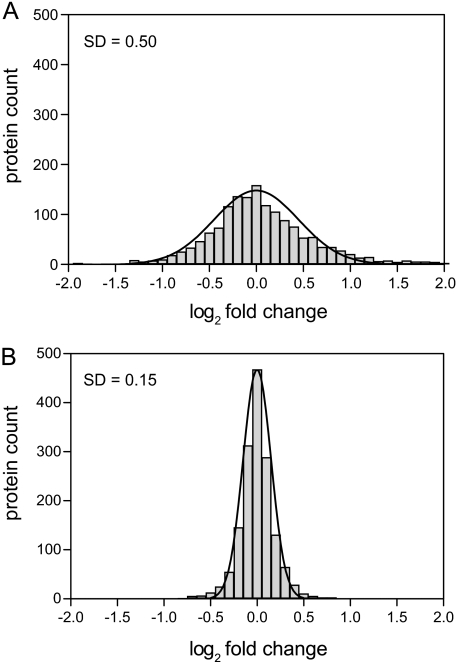
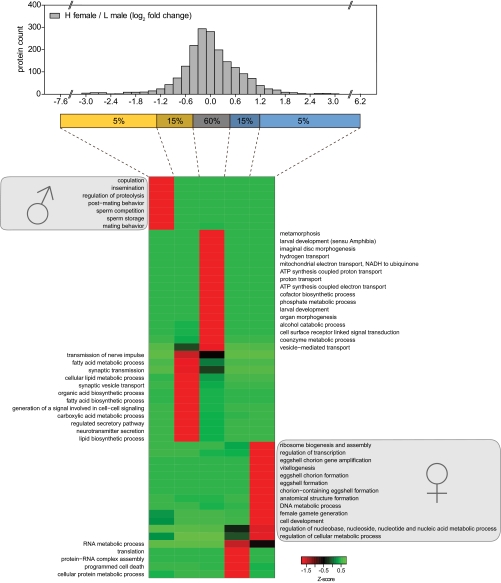
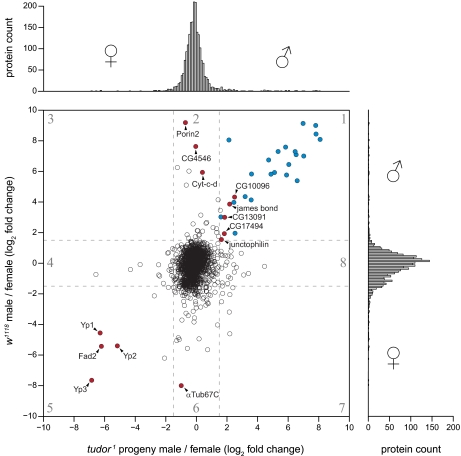
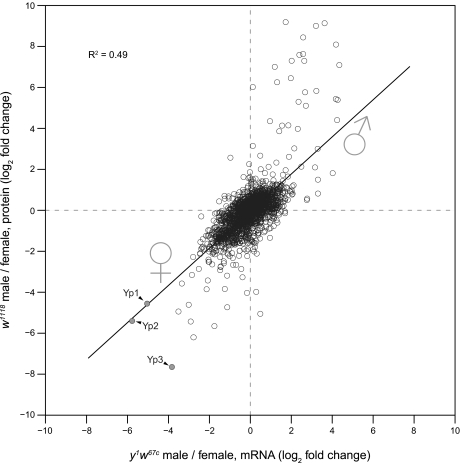
Stable isotope labeling by amino acids in cell culture (SILAC) is widely used to quantify protein abundance in tissue culture cells. Until now, the only multicellular organism completely labeled at the amino acid level was the laboratory mouse. The fruit fly Drosophila melanogaster is one of the most widely used small animal models in biology. Here, we show that feeding flies with SILAC-labeled yeast leads to almost complete labeling in the first filial generation. We used these "SILAC flies" to investigate sexual dimorphism of protein abundance in D. melanogaster. Quantitative proteome comparison of adult male and female flies revealed distinct biological processes specific for each sex. Using a tudor mutant that is defective for germ cell generation allowed us to differentiate between sex-specific protein expression in the germ line and somatic tissue. We identified many proteins with known sex-specific expression bias. In addition, several new proteins with a potential role in sexual dimorphism were identified. Collectively, our data show that the SILAC fly can be used to accurately quantify protein abundance in vivo. The approach is simple, fast, and cost-effective, making SILAC flies an attractive model system for the emerging field of in vivo quantitative proteomics.
Figures
Similar articles
-
In vivo stable isotope labeling by amino acids in Drosophila melanogaster.Methods Mol Biol. 2014;1188:85-93. doi: 10.1007/978-1-4939-1142-4_7. Methods Mol Biol. 2014. PMID: 25059606
-
Stable isotope labeling with amino acids in Drosophila for quantifying proteins and modifications.J Proteome Res. 2012 Sep 7;11(9):4403-12. doi: 10.1021/pr300613c. Epub 2012 Aug 10. J Proteome Res. 2012. PMID: 22830426 Free PMC article.
-
Proteomics meets genetics: SILAC labeling of Drosophila melanogaster larvae and cells for in vivo functional studies.Methods Mol Biol. 2014;1188:293-311. doi: 10.1007/978-1-4939-1142-4_21. Methods Mol Biol. 2014. PMID: 25059620
-
Stable Isotope Labeling by Amino Acids in Cell Culture (SILAC) for Quantitative Proteomics.Adv Exp Med Biol. 2019;1140:531-539. doi: 10.1007/978-3-030-15950-4_31. Adv Exp Med Biol. 2019. PMID: 31347069 Review.
-
Stable isotope labeling by amino acids in cell culture (SILAC) for quantitative proteomics.Adv Exp Med Biol. 2014;806:93-106. doi: 10.1007/978-3-319-06068-2_5. Adv Exp Med Biol. 2014. PMID: 24952180 Review.
Cited by
-
The life history of Drosophila sperm involves molecular continuity between male and female reproductive tracts.Proc Natl Acad Sci U S A. 2022 Mar 15;119(11):e2119899119. doi: 10.1073/pnas.2119899119. Epub 2022 Mar 7. Proc Natl Acad Sci U S A. 2022. PMID: 35254899 Free PMC article.
-
Stable isotope labeling in zebrafish allows in vivo monitoring of cardiac morphogenesis.Mol Cell Proteomics. 2013 Jun;12(6):1502-12. doi: 10.1074/mcp.M111.015594. Epub 2013 Feb 14. Mol Cell Proteomics. 2013. PMID: 23412571 Free PMC article.
-
Quantitative affinity purification mass spectrometry: a versatile technology to study protein-protein interactions.Front Genet. 2015 Jul 14;6:237. doi: 10.3389/fgene.2015.00237. eCollection 2015. Front Genet. 2015. PMID: 26236332 Free PMC article. Review.
-
Analysis of ubiquitinated proteome by quantitative mass spectrometry.Methods Mol Biol. 2012;893:417-29. doi: 10.1007/978-1-61779-885-6_26. Methods Mol Biol. 2012. PMID: 22665315 Free PMC article.
-
Quantitative Mass Spectrometry-Based Proteomics: An Overview.Methods Mol Biol. 2021;2228:85-116. doi: 10.1007/978-1-0716-1024-4_8. Methods Mol Biol. 2021. PMID: 33950486 Review.
References
-
- Cravatt B. F., Simon G. M., Yates J. R., 3rd (2007) The biological impact of mass-spectrometry-based proteomics. Nature 450, 991–1000 - PubMed
-
- Cox J., Mann M. (2007) Is proteomics the new genomics? Cell 130, 395–398 - PubMed
-
- Gstaiger M., Aebersold R. (2009) Applying mass spectrometry-based proteomics to genetics, genomics and network biology. Nat. Rev. Genet. 10, 617–627 - PubMed
-
- Vermeulen M., Selbach M. (2009) Quantitative proteomics: a tool to assess cell differentiation. Curr. Opin. Cell Biol. 21, 761–766 - PubMed
-
- Bantscheff M., Schirle M., Sweetman G., Rick J., Kuster B. (2007) Quantitative mass spectrometry in proteomics: a critical review. Anal. Bioanal. Chem. 389, 1017–1031 - PubMed
Publication types
MeSH terms
Substances
LinkOut - more resources
Full Text Sources
Other Literature Sources
Molecular Biology Databases
