. 2010 Jul;17(7):901-8.
doi: 10.1038/nsmb.1829. Epub 2010 Jun 6.

A plasma-membrane E-MAP reveals links of the eisosome with sphingolipid metabolism and endosomal trafficking

Affiliations

A plasma-membrane E-MAP reveals links of the eisosome with sphingolipid metabolism and endosomal trafficking

Pablo S Aguilar et al. Nat Struct Mol Biol. 2010 Jul.

Abstract

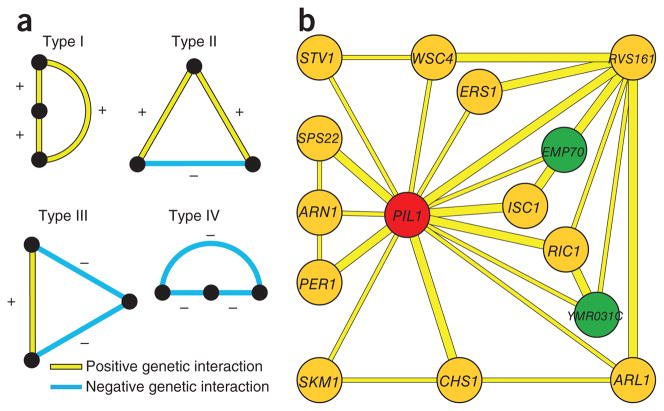
The plasma membrane delimits the cell and controls material and information exchange between itself and the environment. How different plasma-membrane processes are coordinated and how the relative abundance of plasma-membrane lipids and proteins is homeostatically maintained are not yet understood. Here, we used a quantitative genetic interaction map, or E-MAP, to functionally interrogate a set of approximately 400 genes involved in various aspects of plasma-membrane biology, including endocytosis, signaling, lipid metabolism and eisosome function. From this E-MAP, we derived a set of 57,799 individual interactions between genes functioning in these various processes. Using triplet genetic motif analysis, we identified a new component of the eisosome, Eis1, and linked the poorly characterized gene EMP70 to endocytic and eisosome function. Finally, we implicated Rom2, a GDP/GTP exchange factor for Rho1 and Rho2, in the regulation of sphingolipid metabolism.


Conflict of interest statement

COMPETING FINANCIAl INTERESTS

The authors declare no competing financial interests.

Figures

Figure 1
Figure 1
Composition of the plasma membrane E-MAP. (a) Genes selected for the plasma membrane E-MAP are classified according to their biological function. (b,c) Genes encoding proteins interacting with each other are more likely to show positive genetic interactions (b) and correlated genetic interaction profiles (c). Green, interaction and correlation scores of gene pairs known to encode interacting proteins; black, the remainder of gene pairs.
Figure 2
Figure 2
Overview of the clustergram of the plasma membrane E-MAP. Top, selected areas are marked in the overview and highlighted as inserts 1–4. Yellow, positive genetic interactions; blue, negative genetic interactions. Bottom, genes with correlating genetic profiles are shared between RTG1 and MKS1. Pairwise correlations between RTG1 and MKS1 and all other genes in the plasma membrane E-MAP were calculated and plotted against each other.
Figure 3
Figure 3
TGMs of the plasma membrane E-MAP. (a) All four potential TGMs are shown. Nodes in vertical order represent involvement in the same pathway; horizontal orientation indicates possible parallel pathways. (b) Type I TGMs that have PIL1 as a node. Nodes in green represent a gene important for Pil1-GFP localization (YMR031C) or a homolog of such a gene (EMP70).
Figure 4
Figure 4
YMR031C/EIS1 encodes an eisosome component. (a) Affinity purification and MS analysis of heavy labeled cells expressing GFP-tagged Pil1 and untagged control cells. Averaged peptide intensities are plotted against heavy/light SILAC ratios. Significant outliers (P < 0.0001) are colored in orange or light blue (P < 0.05); other identified proteins are shown in dark blue. (b) Pulldown purification from cells expressing tandem affinity-tagged Lsp1, Ymr031c or untagged control cells. Inputs and eluates from the pulldown were blotted and probed with antibodies against Pil1. (c) Colocalization of GFP-tagged Ymr031c with RFPmars-tagged Pil1. Representative confocal midsections are shown. The graph shows the intensity profiles for both channels along the perimeter of the cell. (d) PIL1 is required for normal localization of Ymr031c. Ymr031c-GFP or Lsp1-GFP was expressed and imaged either in WT or pil1Δ cells. Representative confocal midsections are shown. (e,f) Ymr031c is required for normal eisosome formation. Pil1-GFP (e) or Lsp1-GFP (f) was expressed in ymr031cΔ or control cells. Representative midsections are shown. For each experiment, the number of eisosomes per cell, the GFP fluorescence per eisosome and the cytosolic GFP fluorescence were quantified from at least 100 cells and are shown below the images. Scale bars, 2.5 μm.
Figure 5
Figure 5
The eisosome-linked Emp70 is an early endosomal protein. (a) Genes with correlating genetic profiles are shared between PIL1 and EMP70 but not PIL1 and LSP1. Correlation coefficients between the genetic profile of PIL1 and each of the other 373 profiles in the E-MAP are plotted on the x axis against, on the y axis, either the similar set of values for the LSP1 profile with all other profiles (blue) or those for EMP70 with all other profiles (red). Labeled points indicate some genes with profiles that are positively correlated with both the profile of PIL1 and that of EMP70. CC values in blue and red indicate the correlation coefficients for the full set of blue or red points plotted. (b) Emp70 colocalizes with Kex2. Emp70-GFP and Kex2-RFPmars were coexpressed and imaged. Representative confocal midsections are shown. (c) Emp70 localizes to an FM4-64 marked endocytic compartment. Cells expressing Emp70-GFP (green) were pulse labeled with FM4-64 (red) and imaged for 1 h. Images of midsections of cells at selected time are shown as indicated. (d) Emp70 localizes to the class E compartment in SNF7 mutants. GFP-tagged Emp70 was expressed in cells harboring nonfunctional Snf7-RFPmars, resulting in the clustering of endosomal proteins in the class E compartment. Representative confocal midsections are shown. (e) Emp70-GFP foci localize to the cell periphery. Emp70-GFP (green) was expressed in cells harboring the fluorescent eisosomes marker Lsp1-MARS. Representative mid- (left) and top sections (right) are shown. Boxes highlight selected areas of colocalization. (f) PIL1 is required for normal Emp70 localization to the cell periphery. Emp70-GFP was expressed in cells expressing the plasma membrane marker Ylr413w-RFPmars, and foci overlaying this marker were counted in more than 100 WT and pil1Δ cells. Results are shown as a histogram of number of spots opposed to the plasma membrane in each cell. (g) Quantitation of the organelle distribution of Emp70. Emp70-GFP was imaged in live cells and analyzed for colocalization with Kex2-RFPmars (n = 100), vacuolar FM4-64 (n = 91), Snf7-RFPmars (n = 93, diploid strain expressing one tagged Snf7 allele) and Lsp1-Cherry (n = 107). The relative area of overlap between signals was quantified as a percentage of total area occupied by Emp70 signal. Box plots representing maxima, 75th percentile, median, 25th percentile and minima are shown for the colocalization with each marker. Scale bars, 2.5 μm.
Figure 6
Figure 6
Emp70 is required for normal endosome function. (a) EMP70 is required for normal localization of Kex2-GFP. Kex2-GFP was expressed in either WT or emp70Δ cells, and representative confocal midsections are shown. (b) Emp70 family members are required for late endosomal protein retrieval. Mutants of EMP70, TMN2 or TMN3 were tested alone or in combination for CPY secretion. A representative colony blot is shown. Scale bar, 2.5 μm.
Figure 7
Figure 7
Genetic interactions of sphingolipid metabolism. (a) Graphic representation of the sphingolipid synthesis pathway. Blue, negative genetic interactions; yellow, positive interactions. (b) Genes encoding enzymes acting in succession in sphingolipid synthesis show higher correlation than genes further apart in the metabolic network. For each gene pair in sphingolipid synthesis, the pathway distance of genes (that is, the number of metabolic intermediates between the catalyzed reactions) is plotted against the correlation coefficient of the gene pairs. The red line is a best-fit linear regression line fitted for all the data points on the graph.
Figure 8
Figure 8
Rom2 interacts with sphingolipid metabolism. (a) Genes with correlating genetic profiles are shared between SUR4 and ROM2 but not between CSG2 and ROM2. Correlation coefficients between the genetic profile of ROM2 and each of the other 373 profiles in the E-MAP are plotted on the x axis against, on the y axis, either the similar set of values for the SUR4 profile with all other profiles (blue) or those for CSG2 with all other profiles (red). Labeled points indicate genes with profiles that are positively correlated with the profile of ROM2. CC values in blue and red indicate the correlation coefficients for the full set of blue or red points plotted. (b) Lipidome profiling of rom2Δ and selected sphingolipid metabolism mutants. Lipid class abundances were normalized to WT levels. Sterol esters (SE), phosphatidic acid (PA), triacylglycerol (TAG), long chain base (LCB) mannosylinositol phosphoceramide (MIPC), phosphatidylethanolamine (PE), diacylglycerol (DAG), phoshphatidylcholine (PC), phoshphatidylinositol (PI), ceramide (Cer), phosphatidylserine (PS) mannosylinositol-2-phosphoceramide (M(IP)2C) and inositol phosphoceramide (IPC) levels are shown.

References

    1. Grossmann G, Opekarova M, Malinsky J, Weig-Meckl I, Tanner W. Membrane potential governs lateral segregation of plasma membrane proteins and lipids in yeast. EMBO J. 2007;26:1–8. - PMC - PubMed
    1. Walther TC, et al. Eisosomes mark static sites of endocytosis. Nature. 2006;439:998–1003. - PubMed
    1. Grossmann G, et al. Plasma membrane microdomains regulate turnover of transport proteins in yeast. J Cell Biol. 2008;183:1075–1088. - PMC - PubMed
    1. deHart AK, Schnell JD, Allen DA, Hicke L. The conserved Pkh-Ypk kinase cascade is required for endocytosis in yeast. J Cell Biol. 2002;156:241–248. - PMC - PubMed
    1. Friant S, Lombardi R, Schmelzle T, Hall MN, Riezman H. Sphingoid base signaling via Pkh kinases is required for endocytosis in yeast. EMBO J. 2001;20:6783–6792. - PMC - PubMed

Publication types

MeSH terms