. 2010 Jul;16(7):821-7.
doi: 10.1038/nm.2167. Epub 2010 Jun 6.

Rapid functional dissection of genetic networks via tissue-specific transduction and RNAi in mouse embryos

Affiliations

Rapid functional dissection of genetic networks via tissue-specific transduction and RNAi in mouse embryos

Slobodan Beronja et al. Nat Med. 2010 Jul.

Abstract

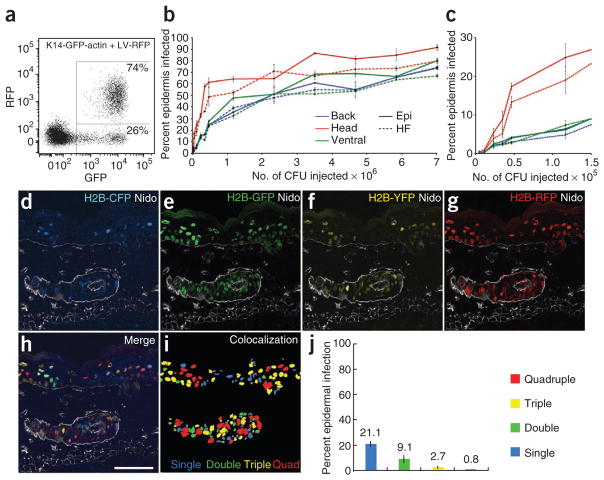
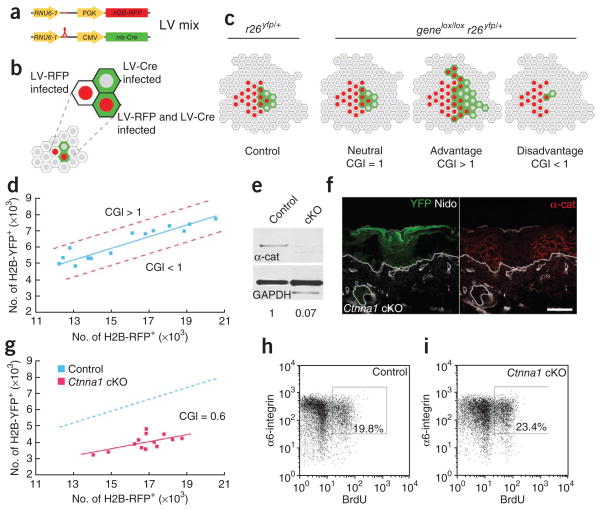
Using ultrasound-guided in utero infections of fluorescently traceable lentiviruses carrying RNAi or Cre recombinase into mouse embryos, we have demonstrated noninvasive, highly efficient selective transduction of surface epithelium, in which progenitors stably incorporate and propagate the desired genetic alterations. We achieved epidermal-specific infection using small generic promoters of existing lentiviral short hairpin RNA libraries, thus enabling rapid assessment of gene function as well as complex genetic interactions in skin morphogenesis and disease in vivo. We adapted this technology to devise a new quantitative method for ascertaining whether a gene confers a growth advantage or disadvantage in skin tumorigenesis. Using alpha1-catenin as a model, we uncover new insights into its role as a widely expressed tumor suppressor and reveal physiological interactions between Ctnna1 and the Hras1-Mapk3 and Trp53 gene pathways in regulating skin cell proliferation and apoptosis. Our study illustrates the strategy and its broad applicability for investigations of tissue morphogenesis, lineage specification and cancers.


Conflict of interest statement

COMPETING FINANCIAL INTERESTS

The authors declare no competing financial interests.

Figures

Figure 1
Figure 1
Intra-amniotic injection of lentivirus at E9.5 results in noninvasive, high-efficiency, stable and epidermally restricted transduction. (a) Lentiviral constructs used in the study. Modifications are of pLKO.1, a generic lentiviral vector for expressing human RNU6-1 promoter-driven short hairpin RNAs (shRNAs; red loop). LTR, long terminal repeat; ψ, retroviral packaging element; RRE, Rev response element; cPPT, central polypurine tract; PGK, phosphoglycerate kinase promoter; H2B-XFP, Hist2h2be fused to cDNA of genes encoding fluorescent proteins GFP, RFP, CFP or YFP; nls, nuclear localization signal; CMV, cytomegalovirus promoter; LV, lentivirus; Cre, bacterial Cre recombinase. (b–d) LV-GFP infection of E9.5 embryos analyzed at E15.5 (b) or E18.5 (c) relative to non-infected control (d). (e–h) Back skin sections of E9.5 LV-GFP infected control (e,f) and LV-Cre infected r26yfp/+ Cre-reporter embryos (g,h) analyzed at E18.5 (e,g) or 12 weeks (f,h). Transduced cells are YFP+ or H2B-GFP+. Nidogen (Nido) demarcates basement membrane and dermal blood vessels. (i) Newborn back skin section at high LV-Cre infection efficiency; boxed area, enlarged and shown as an inset, shows a single non-infected hair follicle with an overlying patch of YFP epidermis. Epi, epidermis; Der, dermis; HF, hair follicle. Scale bars, 3 mm (b), 5 mm (c,d), 50 μm (e–h, inset), 100 μm (i).
Figure 2
Figure 2
Epidermal infection depends on viral titer and permits delivery of multiple viral constructs. (a) FACS analysis of K14actin-GFP embryos infected at E9.5 with LV-RFP and analyzed at E18.5. Note that only GFP+ cells are RFP+, consistent with epidermally restricted transduction. (b) Relationship between viral titer and epidermal infection efficiency as determined by FACS analysis of hair follicle and epidermal compartments of different skin regions of E18.5 embryos infected with LV-RFP. Epi, epidermis; HF, hair follicle. (c) Close-up view of lower titer part of the graph in b. Note the more efficient transduction of head skin at lower viral titers. (d–i) Representative back skin section from an E18.5 embryo simultaneously infected with LV-CFP, LV-GFP, LV-YFP and LV-RFP. Shown are single-color (d–g) and merged (h) images. Note that for this particular embryo, overall infection was ~34%, and ~66% of the cells were uninfected. (i) Colocalization of binarized single fluorescence images, color coded to mark single, double, triple and quadruple infection. (j) FACS quantification of co-infection efficiency, color coded as in i. Abbreviations: Epi, epidermis; HF, hair follicle. Nidogen (Nido) demarcates basement membrane and dermal blood vessels. Scale bar, 50 μm.
Figure 3
Figure 3
Rapid assay for measuring an epidermal growth advantage or disadvantage conferred by a gene mutation reveals an unexpected growth disadvantage following α1-catenin loss despite hyperproliferation. (a–c) Schematic of the cellular growth index (CGI) assay. E9.5 Cre reporter embryos are infected with a mix of LV-Cre and LV-RFP, resulting in epidermal cells that have been transduced and that express H2B-RFP, H2B-YFP or both (a,b). At E18.5, the relative ratios of H2B-RFP+ to YFP+ cells in control (r26yfp/+) and gene knockout (genelox/loxr26yfp/+) mice are compared (c). Phenotypes are scored as either being neutral or having a growth advantage or disadvantage depending on this CGI value. (d) Graph of FACS-quantified numbers of H2B-RFP+ cells relative to YFP+ cells in control mice at E18.5. Genes whose depletion results in a growth advantage or disadvantage would shift the curve toward the upper or lower dashed red lines, respectively. (e) Quantified anti–α1-catenin (α-cat; test) and glyceraldehyde phosphate dehydrogenase (GAPDH; control) immunoblots of protein lysates from cells FACS-sorted from LV-Cre–infected control and Ctnna1-floxed (cKO) embryos. (f) Back skin sections of LV-Cre Ctnna1lox/lox r26yfp/+ (Ctnna1 cKO) embryos immunolabeled with anti–α1-catenin. Transduced cells are indicated by their YFP expression. (g) Graph of numbers of H2B-RFP+ cells relative to YFP+ cells in control (as in d) and Ctnna1 cKO mice at E18.5. Note the reduced CGI (0.6; P < 0.001) in the Ctnna1 cKO clones. (h,i) FACS plots and quantification of % basal (α6-integrin+) cells that incorporated BrdU after a 6-h labeling of E18.5 embryos. Note elevated BrdU incorporation despite the growth disadvantage in Ctnna1 cKO skin. Nidogen (Nido) marks the epidermal-dermal boundary as well as dermal blood vessels. Scale bar, 50 μm.
Figure 4
Figure 4
Efficient epidermal-specific lentivirus RNAi-mediated knockdown of Ctnna1 faithfully recapitulates phenotypic abnormalities shown by K14-Cre conditional and LV-Cre induced knockout counterparts. (a) TRC RNAi library shRNA constructs (arrowheads) corresponding to Ctnna1. Numbers correspond to TRC nomenclature. (b) Anti–α1-catenin and GAPDH immunoblots of protein lysates of cells FACS-sorted from embryos infected with LV-GFP harboring Ctnna1-specific shRNAs (shCtnna1) and control scrambled shRNA (shScram). (c) Quantification of α1-catenin levels from blot in b. (d–i) Comparative analyses of representative P0 skin sections of conditional Ctnna1 knockout (Ctnna1 cKO), shCtnna1-912 knockdown (Ctnna1 RNAi) and shScram control (Scram RNAi) embryos. (d) α1-Catenin immunolabeling reveals efficient knockdown in all shCtnna1-912 infected (H2B-GFP+) but not uninfected cells. (e–g) Morphological and adherens junction defects, not found in shScram RNAi–infected skin, are similar between cells infected with Ctnna1 cKO (f) and Ctnna1 RNAi (g). Boxed areas are shown in insets. Arrowheads denote hair follicles derived from infected epidermis. Note that asymmetric E-cadherin localization seen in shScram RNAi–infected (e) or uninfected areas (f) is consistently lost in Ctnna1 RNAi–infected skin (g), indicative of a planar cell polarity defect. (h,i) Suprabasal keratin 6 (K6), often reflective of enhanced basal cell proliferation, is detected in Ctnna1 cKO (h) and Ctnna1 RNAi (i) cell clones. Transduced cells are identified by their YFP or H2B-GFP expression. Nidogen (Nido) marks the basement membrane and dermal blood vessels. Epidermal adherens junctions are marked by antibody to E-cadherin (Ecad). Primary antibodies are noted on each frame, with color coding according to secondary antibodies used. Scale bars, 50 μm.
Figure 5
Figure 5
Use of RNAi knockdown in vivo to functionally dissect why loss of α1-catenin results in hyperproliferation but a growth disadvantage to the epidermis. (a–b) Efficiency of Hras1 and Mapk3 RNAi knockdowns in vitro and in vivo as determined in embryos and cultured keratinocytes subjected to lentivirus-mediated RNAi knockdown with shHras1-267, shMapk-357 or control scrambled shRNA (shScram). (a) Real-time PCR quantification of Hras1 and Mapk3 transcripts from keratinocytes. (b) Immunoblot analysis of Hras1 and Mapk3 protein levels in embryos (data normalized to control values of 100%). (c) Effects of Hras1 and Mapk3 RNAi on BrdU incorporation in control and LV-Cre Ctnna1 cKO embryos following a 6-h pulse of BrdU. Data were quantified by FACS. (d–i) Trp53-dependent apoptosis occurs in Ctnna1 cKO skin in vivo and is directly responsible for the reduced CGI. (d) Apoptotic cells (marked by active caspase 3) in clonal patches of Ctnna1 cKO skin, marked by YFP expression. Quantifications are shown in g. Nidogen (Nido) marks basement membrane and dermal blood vessels. DAPI (blue) labels the nuclei. (e) Fold changes in in vivo transcript levels, normalized to LV-Cre–infected control embryos (red dashed line), of TRP53 signature target genes in cells FACS-sorted from Ctnna1 cKO embryos alone or Ctnna1 cKO embryos infected with shTrp53-1223 (Ctnna1 cKO + Trp53 KD). (f) Levels of Trp53 transcripts in vitro and in vivo after lentivirus-mediated RNAi knockdown in keratinocytes and embryos. Two different Trp53 shRNAs are tested. (g) Percentage of active caspase 3+ cells in control and Ctnna1 cKO cells in the presence and absence of Trp53 RNAi in vivo. (h) Graph of numbers of RFP+ cells relative to YFP+ cells at E18.5 in control and Ctnna1 KO mice infected with shTrp53-1223. CGI = 0.8 (P < 0.001). (i) Comparison of CGI for control (wt), Ctnna1 knockout (cKO) and Ctnna1 knockout with Trp53 knockdown (cKO + Trp53 KD) embryos. * denotes CGI values that show significant differences (P < 0.001). Scale bar, 50 μm.

References

    1. Holzinger A, Trapnell BC, Weaver TE, Whitsett JA, Iwamoto HS. Intraamniotic administration of an adenoviral vector for gene transfer to fetal sheep and mouse tissues. Pediatr Res. 1995;38:844–850. - PubMed
    1. Lu B, Federoff HJ, Wang Y, Goldsmith LA, Scott G. Topical application of viral vectors for epidermal gene transfer. J Invest Dermatol. 1997;108:803–808. - PubMed
    1. Liu A, Joyner AL, Turnbull DH. Alteration of limb and brain patterning in early mouse embryos by ultrasound-guided injection of Shh-expressing cells. Mech Dev. 1998;75:107–115. - PubMed
    1. Slevin JC, et al. High resolution ultrasound-guided microinjection for interventional studies of early embryonic and placental development in vivo in mice. BMC Dev Biol. 2006;6:10. - PMC - PubMed
    1. Endo M, et al. Efficient in vivo targeting of epidermal stem cells by early gestational intraamniotic injection of lentiviral vector driven by the keratin 5 promoter. Mol Ther. 2008;16:131–137. - PMC - PubMed

Publication types