

Reactive control and its operation limits in responding to a novel slip in gait
- PMID: 20526677
- PMCID: PMC3390206
- DOI: 10.1007/s10439-010-0082-7
Reactive control and its operation limits in responding to a novel slip in gait
Abstract
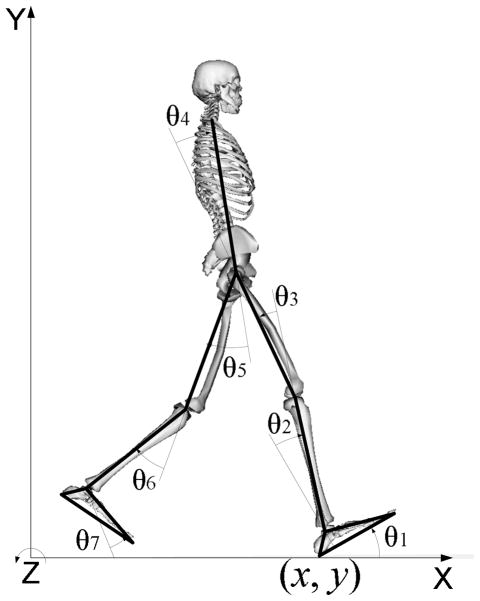
The purposes of this study were: (1) to examine the reactive control of the resultant joint moments at the lower limbs in response to a novel and unannounced slip; (2) to establish individualized forward-dynamics models; and (3) to explore personal potential by determining the operation limits of these moments at each lower limb joint, beyond which the resulting motion at this or other joints will exceed its/their normal range(s). Ten young subjects' kinematics and kinetics, collected during regular walking and during their first exposure to a novel and unannounced slip, were randomly selected from an existing database. An inverse-dynamics approach was applied to derive their (original) resultant joint moments, which were then used as input to establish forward-dynamics models, each including an individualized 16-element foot model to simulate ground reaction force. A simulated annealing (SA) algorithm was applied to modify the original moments, so that the subsequent output (baseline) moments can closely reproduce these subjects' recorded motion. A systematic alteration of the baseline moments was employed to determine the operation limits. The results revealed that the subjects reactively increased the hip extensor and knee flexor moments and reduced their ankle plantar flexor moments of their single-stance limb following slip onset. The "baseline" correction of the original moments can reach as much as 21% of the original moments. The analysis of the operation limits revealed that these individuals may be able to further increase their knee flexors more so than increase the hip extensors or reduce ankle plantar flexors before causing abnormal joint movement. Such systematic approach opens the possibility to properly assess an individual's rehabilitation potential, and to identify whether this person's strength is the limiting factor for stability training.
Figures


Similar articles
-
Role of individual lower limb joints in reactive stability control following a novel slip in gait.J Biomech. 2010 Feb 10;43(3):397-404. doi: 10.1016/j.jbiomech.2009.10.003. Epub 2009 Nov 5. J Biomech. 2010. PMID: 19896133 Free PMC article.
-
The effect of the most common gait perturbations on the compensatory limb's ankle, knee, and hip moments during the first stepping response.Gait Posture. 2019 Jun;71:98-104. doi: 10.1016/j.gaitpost.2019.04.013. Epub 2019 Apr 20. Gait Posture. 2019. PMID: 31031225
-
Contributions to the understanding of gait control.Dan Med J. 2014 Apr;61(4):B4823. Dan Med J. 2014. PMID: 24814597 Review.
-
Mechanisms contributing to different joint moments observed during human walking.Scand J Med Sci Sports. 1997 Feb;7(1):1-13. doi: 10.1111/j.1600-0838.1997.tb00110.x. Scand J Med Sci Sports. 1997. PMID: 9089898
-
Prediction of Gait Kinematics and Kinetics: A Systematic Review of EMG and EEG Signal Use and Their Contribution to Prediction Accuracy.Bioengineering (Basel). 2023 Oct 4;10(10):1162. doi: 10.3390/bioengineering10101162. Bioengineering (Basel). 2023. PMID: 37892892 Free PMC article. Review.
Cited by
-
Generalization of motor adaptation to repeated-slip perturbation across tasks.Neuroscience. 2011 Apr 28;180:85-95. doi: 10.1016/j.neuroscience.2011.02.039. Epub 2011 Feb 23. Neuroscience. 2011. PMID: 21352898 Free PMC article.
-
How Compliance of Surfaces Affects Ankle Moment and Stiffness Regulation During Walking.Front Bioeng Biotechnol. 2021 Oct 5;9:726051. doi: 10.3389/fbioe.2021.726051. eCollection 2021. Front Bioeng Biotechnol. 2021. PMID: 34676201 Free PMC article.
-
Neuromuscular mechanisms of motor adaptation to repeated gait-slip perturbations in older adults.Sci Rep. 2022 Nov 18;12(1):19851. doi: 10.1038/s41598-022-23051-w. Sci Rep. 2022. PMID: 36400866 Free PMC article.
References
-
- Anderson FC. PhD dissertation. University of Texas at Austin; Austin, Texas: 1999. A dynamic optimization solution for a complete cycle of normal gait: An analysis of muscle function and joint contact force.
-
- Anderson FC, Goldberg SR, Pandy MG. Contributions of muscle forces and toe-off kinematics to peak knee flexion during the swing phase of normal gait: an induced position analysis. J Biomech. 2004;37:731–737. - PubMed
-
- Anderson FC, Pandy MG. Dynamic optimization of human walking. J Biomech Eng. 2001;123:381–390. - PubMed
Publication types
MeSH terms
Grants and funding
LinkOut - more resources
Full Text Sources
Medical
