Comparative Study
. 2010 Dec;11(4):625-40.
doi: 10.1007/s10162-010-0222-7. Epub 2010 Jun 5.

Pitch comparisons between electrical stimulation of a cochlear implant and acoustic stimuli presented to a normal-hearing contralateral ear

Affiliations
Comparative Study

Pitch comparisons between electrical stimulation of a cochlear implant and acoustic stimuli presented to a normal-hearing contralateral ear

Robert P Carlyon et al. J Assoc Res Otolaryngol. 2010 Dec.

Abstract

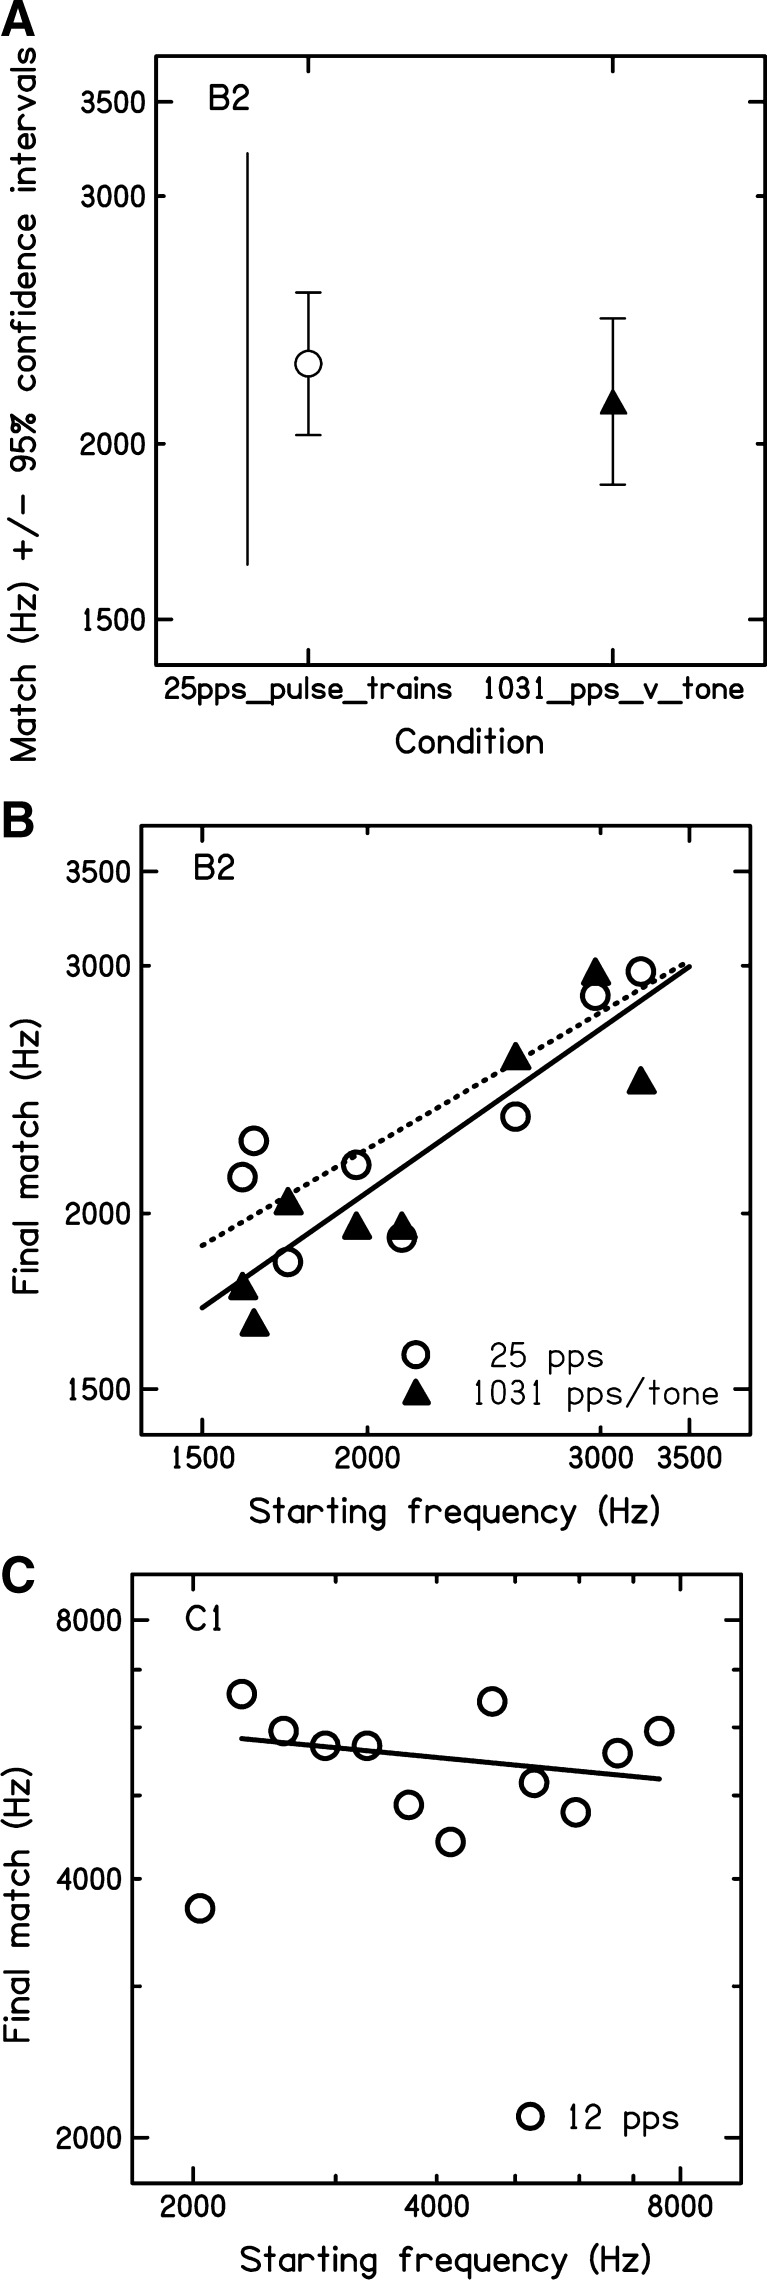
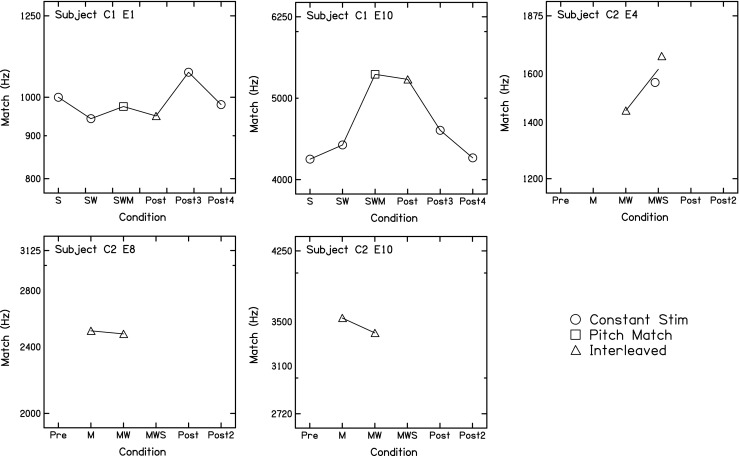
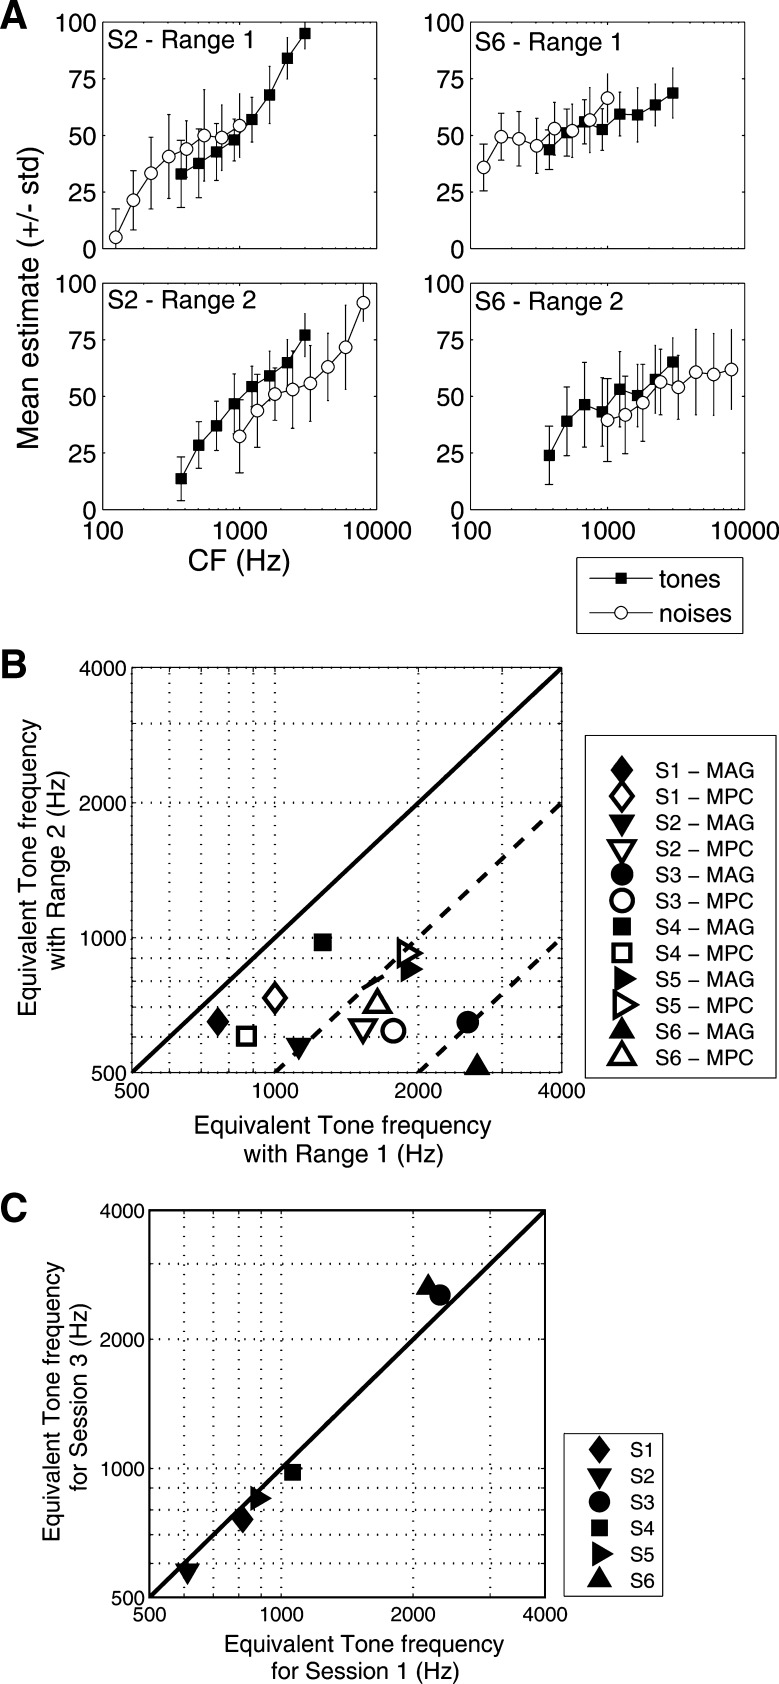
Four cochlear implant users, having normal hearing in the unimplanted ear, compared the pitches of electrical and acoustic stimuli presented to the two ears. Comparisons were between 1,031-pps pulse trains and pure tones or between 12 and 25-pps electric pulse trains and bandpass-filtered acoustic pulse trains of the same rate. Three methods-pitch adjustment, constant stimuli, and interleaved adaptive procedures-were used. For all methods, we showed that the results can be strongly influenced by non-sensory biases arising from the range of acoustic stimuli presented, and proposed a series of checks that should be made to alert the experimenter to those biases. We then showed that the results of comparisons that survived these checks do not deviate consistently from the predictions of a widely-used cochlear frequency-to-place formula or of a computational cochlear model. We also demonstrate that substantial range effects occur with other widely used experimental methods, even for normal-hearing listeners.


Figures

FIG. 1
FIG. 1
Part A shows psychometric functions obtained by subject B1 on electrode 6. Data obtained with a 25-pps pulse train in each ear and with a 1,031-pps pulse train vs. a pure tone are shown by circles and triangles, respectively. Psychometric functions measured using the lower and higher ranges of acoustic stimuli are shown by dotted and solid lines, respectively. Part B shows functions obtained for 12-pps pulse trains presented to subject C1’s electrode 1.
FIG. 2
FIG. 2
A Average pitch adjustments, together with 95% confidence limits made by subject B2 for electrode 9. Results obtained with 25-pps pulse trains in each ear are shown by the open circle; those obtained with a pure tone and a 1,031-pps pulse train are shown by the filled triangle. The range of starting frequencies is shown by the vertical bar. Part B shows the correlation between final match and starting frequency for the data shown in part A. Part C shows a similar correlation obtained by subject C1 on electrode 10 with a 12-pps pulse train in each ear.
FIG. 3
FIG. 3
Changes in matched frequencies over time. The different methods are shown by different symbols, as illustrated by the key in the bottom right of the Figure. The abbreviations used for the different time points are as follows: Pre at the start of the tinnitus study, prior to any microphone or mp3 input; m after listening through mp3 player via auxiliary input, w washout period (speech processor removed), s speech mode (microphone activated). Post after all stages of the tinnitus study, and after some additional period of listening in “speech” mode (i.e., through the microphone input). "Post2", "Post3" and "Post4" refer to sessions run 3, 6, and 12 months after the end of the mp3 phase.
FIG. 4
FIG. 4
The dashed line in each panel shows the predicted (center) frequency corresponding to each electrode for a given subject, according the formula proposed by Greenwood (1990). Dotted lines show ±0.5 octaves re this prediction. The solid line shows the predictions of the Leiden model. For subject C2, the thick gray line shows predictions based on Greenwood’s formula for the first of the two scans obtained (see text for details), with the other lines showing predictions based on the second scan. Insertion angles, using the reference point described in the Methods section, are shown on the top of each plot. Where more than one reliable match was obtained for a given electrode, the geometric mean is shown by a solid square; in this case, the error bars show the 95% confidence limits estimated from the PSEs obtained with the individual measures. Where only one reliable match was obtained, the PSE is shown by an open symbol, with the shape of the symbol reflecting the method used (see key). In this case, and for the constant-stimuli and interleaved adaptive procedures, the error bars span the distance from the PSE obtained with the lower range to that obtained with the higher range. For the pitch-matching procedure, it spans the 95% confidence limits around the average match. Where error bars are not visible they are smaller than the symbols.
FIG. 5
FIG. 5
Part A shows results obtained from the first two sessions for two of the normal-hearing subject participating in the magnitude-estimation experiment. Functions are shown separately for tones and noises, even though they were always mixed within each block. The top and bottom rows show data obtained with the noises in the lower and upper ranges, respectively. The filled symbols in part B show the estimated frequency for each tone, corresponding to a noise centered on 1,000 Hz, when the noises were in the upper range, versus the estimated frequency when the noise was in the lower range. Data are shown for all subjects, using different symbols for each one; the open symbols show the same comparison for the midpoint comparison procedure. Part C shows the frequency of a pure tone assigned the same number as the 1,000-Hz noise in sessions 1 (abscissa) and 3 (ordinate), during which the noise center frequencies were in the same range.

Similar articles

Cited by

References

    1. Blamey PJ, Dooley GJ, Parisi ES, Clark GM. Pitch comparisons of acoustically and electrically evoked auditory sensations. Hear Res. 1996;99:139–150. doi: 10.1016/S0378-5955(96)00095-0. - DOI - PubMed
    1. Boëx C, Baud L, Cosendai G, Sigrist A, Kós M-I, Pelizzone M. Acoustic to electric pitch comparisons in cochlear implant subjects with residual hearing. JARO. 2006;7:110–124. doi: 10.1007/s10162-005-0027-2. - DOI - PMC - PubMed
    1. Briaire JJ, Frijns JHM. Unraveling the electrically evoked compound action potential. Hear Res. 2005;205:143–156. doi: 10.1016/j.heares.2005.03.020. - DOI - PubMed
    1. Briaire JJ, Frijns JHM. The consequences of neural degeneration regarding optimal cochlear implant position in scala tympani: a model approach. Hear Res. 2006;214:17–27. doi: 10.1016/j.heares.2006.01.015. - DOI - PubMed
    1. Burns EM, Viemeister NF. Played again SAM: Further observations on the pitch of amplitude-modulated noise. J Acoust Soc Am. 1981;70:1655–1660. doi: 10.1121/1.387220. - DOI

Publication types