

Rank estimation and the multivariate analysis of in vivo fast-scan cyclic voltammetric data
- PMID: 20527815
- PMCID: PMC2895304
- DOI: 10.1021/ac100413t
Rank estimation and the multivariate analysis of in vivo fast-scan cyclic voltammetric data
Abstract
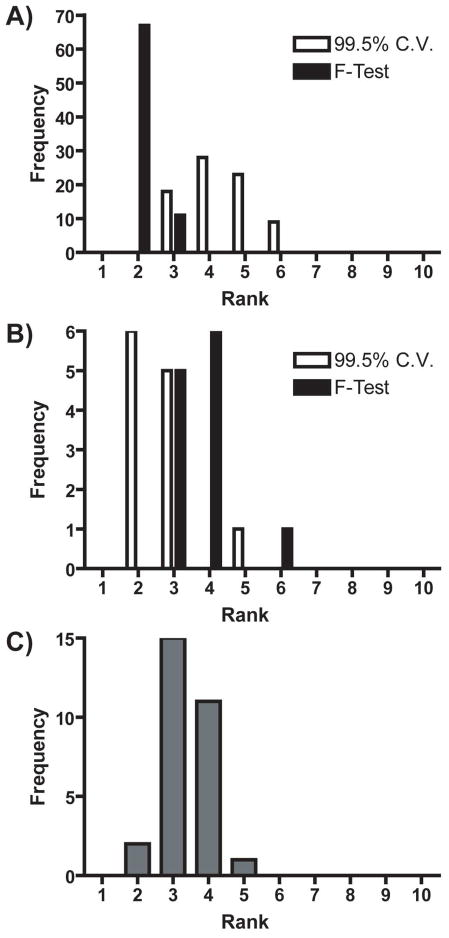
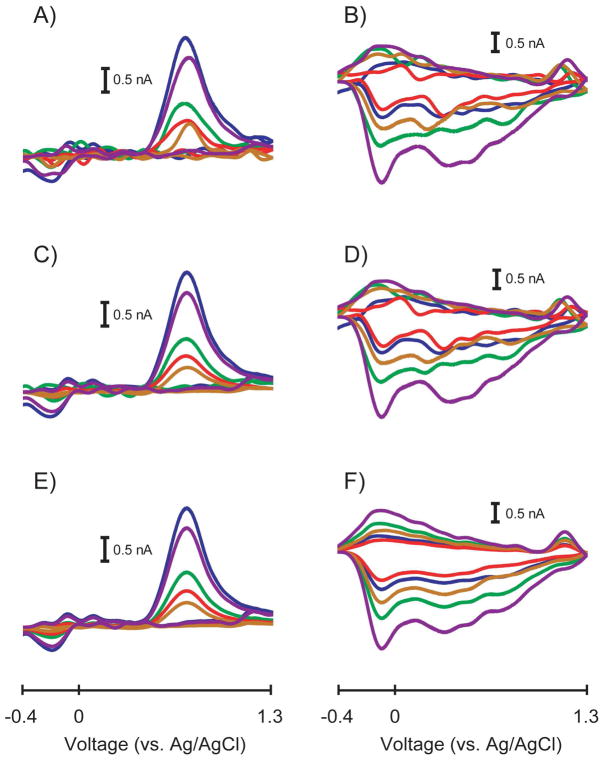
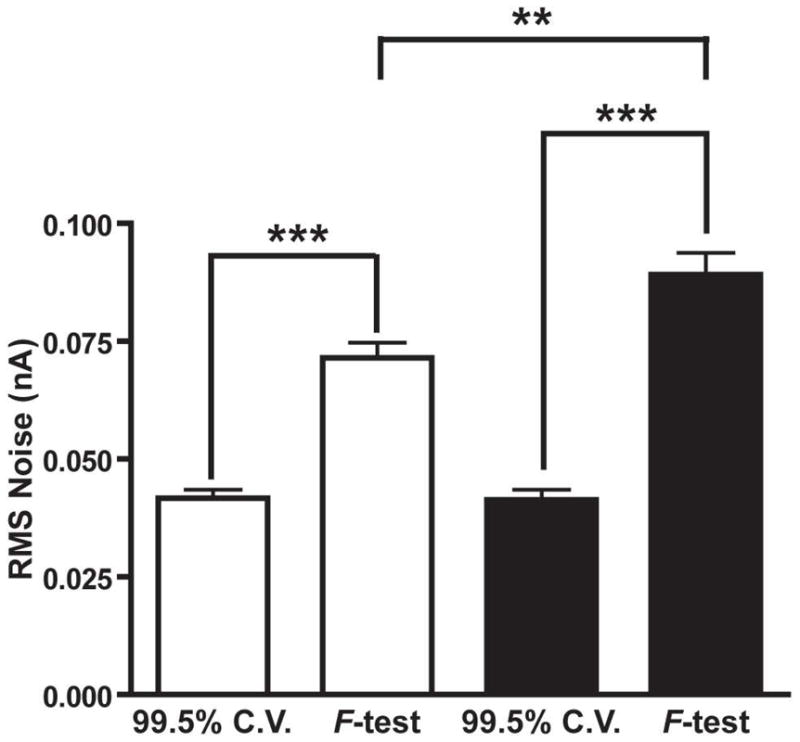
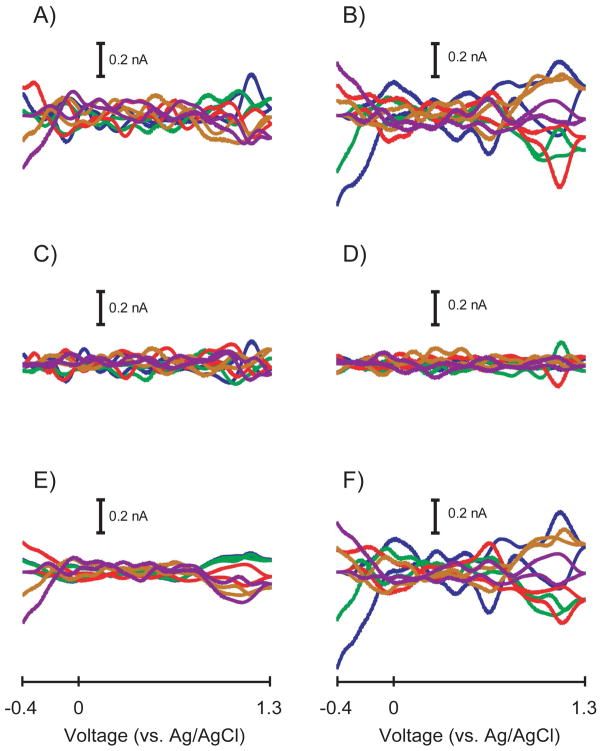
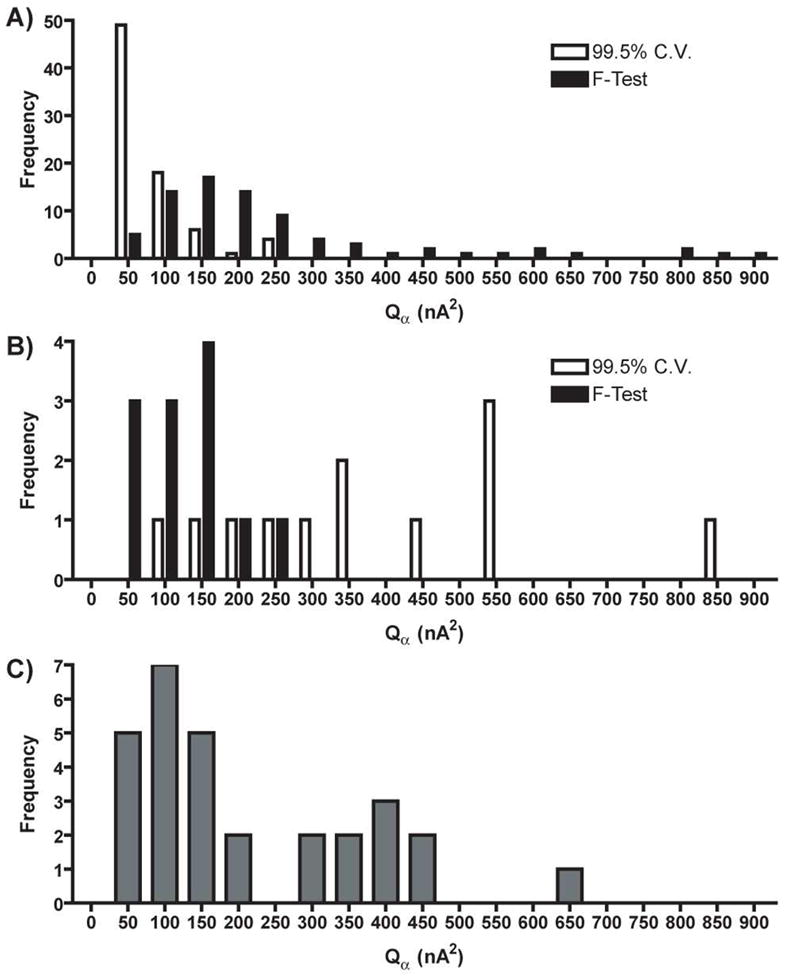
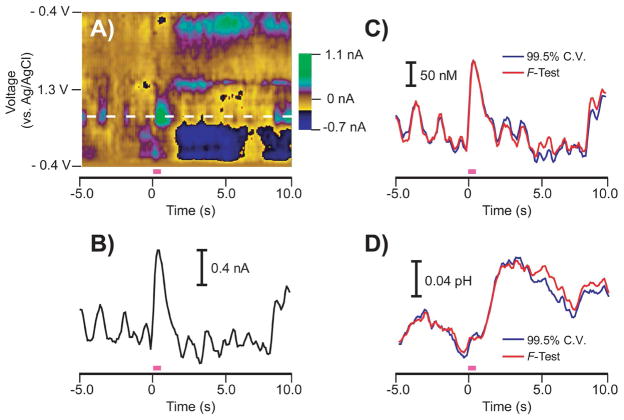
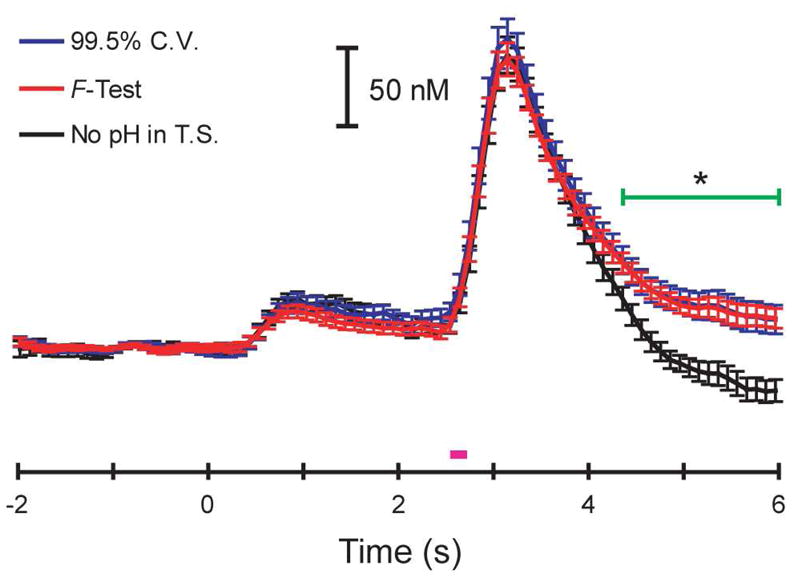
Principal component regression has been used in the past to separate current contributions from different neuromodulators measured with in vivo fast-scan cyclic voltammetry. Traditionally, a percent cumulative variance approach has been used to determine the rank of the training set voltammetric matrix during model development; however, this approach suffers from several disadvantages including the use of arbitrary percentages and the requirement of extreme precision of training sets. Here, we propose that Malinowski's F-test, a method based on a statistical analysis of the variance contained within the training set, can be used to improve factor selection for the analysis of in vivo fast-scan cyclic voltammetric data. These two methods of rank estimation were compared at all steps in the calibration protocol including the number of principal components retained, overall noise levels, model validation as determined using a residual analysis procedure, and predicted concentration information. By analyzing 119 training sets from two different laboratories amassed over several years, we were able to gain insight into the heterogeneity of in vivo fast-scan cyclic voltammetric data and study how differences in factor selection propagate throughout the entire principal component regression analysis procedure. Visualizing cyclic voltammetric representations of the data contained in the retained and discarded principal components showed that using Malinowski's F-test for rank estimation of in vivo training sets allowed for noise to be more accurately removed. Malinowski's F-test also improved the robustness of our criterion for judging multivariate model validity, even though signal-to-noise ratios of the data varied. In addition, pH change was the majority noise carrier of in vivo training sets while dopamine prediction was more sensitive to noise.
Figures
Similar articles
-
Hitchhiker's Guide to Voltammetry: Acute and Chronic Electrodes for in Vivo Fast-Scan Cyclic Voltammetry.ACS Chem Neurosci. 2017 Feb 15;8(2):221-234. doi: 10.1021/acschemneuro.6b00393. Epub 2017 Feb 9. ACS Chem Neurosci. 2017. PMID: 28127962 Free PMC article. Review.
-
Failure of Standard Training Sets in the Analysis of Fast-Scan Cyclic Voltammetry Data.ACS Chem Neurosci. 2016 Mar 16;7(3):349-59. doi: 10.1021/acschemneuro.5b00302. Epub 2016 Jan 27. ACS Chem Neurosci. 2016. PMID: 26758246 Free PMC article.
-
Improving in Situ Electrode Calibration with Principal Component Regression for Fast-Scan Cyclic Voltammetry.Anal Chem. 2018 Nov 20;90(22):13434-13442. doi: 10.1021/acs.analchem.8b03241. Epub 2018 Oct 29. Anal Chem. 2018. PMID: 30335966
-
Construction of Training Sets for Valid Calibration of in Vivo Cyclic Voltammetric Data by Principal Component Analysis.Anal Chem. 2015 Nov 17;87(22):11484-91. doi: 10.1021/acs.analchem.5b03222. Epub 2015 Oct 27. Anal Chem. 2015. PMID: 26477708 Free PMC article.
-
Translational Metabolomics of Head Injury: Exploring Dysfunctional Cerebral Metabolism with Ex Vivo NMR Spectroscopy-Based Metabolite Quantification.In: Kobeissy FH, editor. Brain Neurotrauma: Molecular, Neuropsychological, and Rehabilitation Aspects. Boca Raton (FL): CRC Press/Taylor & Francis; 2015. Chapter 25. In: Kobeissy FH, editor. Brain Neurotrauma: Molecular, Neuropsychological, and Rehabilitation Aspects. Boca Raton (FL): CRC Press/Taylor & Francis; 2015. Chapter 25. PMID: 26269925 Free Books & Documents. Review.
Cited by
-
Examining the complex regulation and drug-induced plasticity of dopamine release and uptake using voltammetry in brain slices.ACS Chem Neurosci. 2013 May 15;4(5):693-703. doi: 10.1021/cn400026v. Epub 2013 May 6. ACS Chem Neurosci. 2013. PMID: 23581570 Free PMC article. Review.
-
Examination of Rapid Dopamine Dynamics with Fast Scan Cyclic Voltammetry During Intra-oral Tastant Administration in Awake Rats.J Vis Exp. 2015 Aug 12;(102):e52468. doi: 10.3791/52468. J Vis Exp. 2015. PMID: 26325447 Free PMC article.
-
Multivariate Curve Resolution for Signal Isolation from Fast-Scan Cyclic Voltammetric Data.Anal Chem. 2017 Oct 3;89(19):10547-10555. doi: 10.1021/acs.analchem.7b02771. Epub 2017 Sep 13. Anal Chem. 2017. PMID: 28840722 Free PMC article.
-
Dynamics of rapid dopamine release in the nucleus accumbens during goal-directed behaviors for cocaine versus natural rewards.Neuropharmacology. 2014 Nov;86:319-28. doi: 10.1016/j.neuropharm.2014.08.006. Epub 2014 Aug 29. Neuropharmacology. 2014. PMID: 25174553 Free PMC article.
-
Hitchhiker's Guide to Voltammetry: Acute and Chronic Electrodes for in Vivo Fast-Scan Cyclic Voltammetry.ACS Chem Neurosci. 2017 Feb 15;8(2):221-234. doi: 10.1021/acschemneuro.6b00393. Epub 2017 Feb 9. ACS Chem Neurosci. 2017. PMID: 28127962 Free PMC article. Review.
References
-
- Lavine B, Workman J. Anal Chem. 2008;80:4519–4531. - PubMed
-
- Bro R. Anal Chim Acta. 2003;500:185–194.
-
- Bjallmark A, Lind B, Peolsson M, Shahgaldi K, Brodin LA, Nowak J. Eur J Echocardiogr. 2010 - PubMed
-
- Heise HM. Hormone and Metabolic Research. 1996;28:527–534. - PubMed
-
- Hansson LO, Waters N, Holm S, Sonesson C. J Med Chem. 1995;38:3121–3131. - PubMed
Publication types
MeSH terms
Substances
Grants and funding
LinkOut - more resources
Full Text Sources
Miscellaneous
