. 2010 Nov;16(11):3285-98.
doi: 10.1089/ten.TEA.2010.0166. Epub 2010 Jul 12.

Unique differentiation profile of mouse embryonic stem cells in rotary and stirred tank bioreactors

Affiliations

Unique differentiation profile of mouse embryonic stem cells in rotary and stirred tank bioreactors

Krista M Fridley et al. Tissue Eng Part A. 2010 Nov.

Abstract

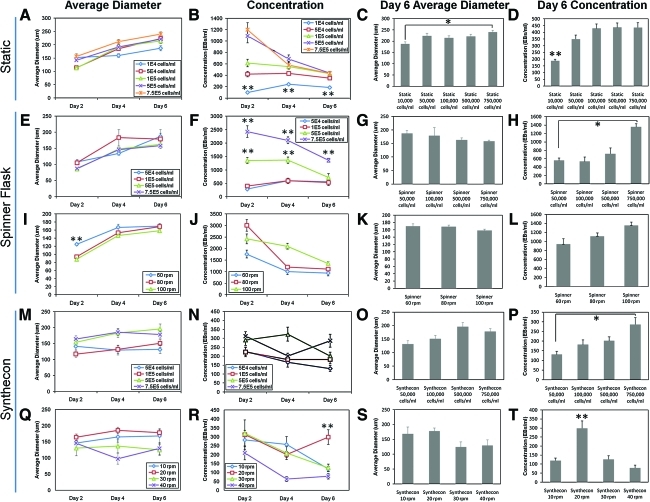
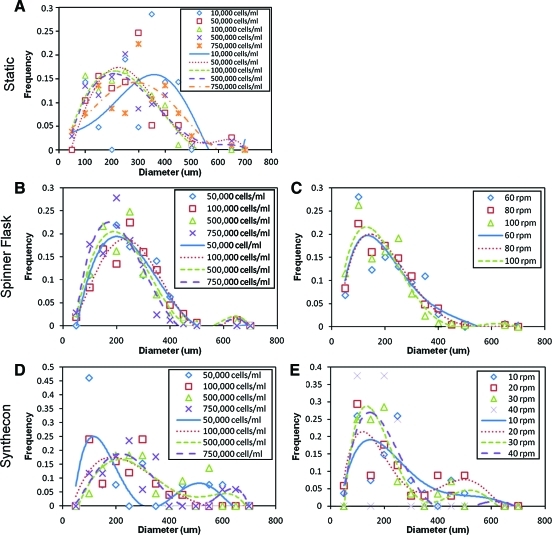
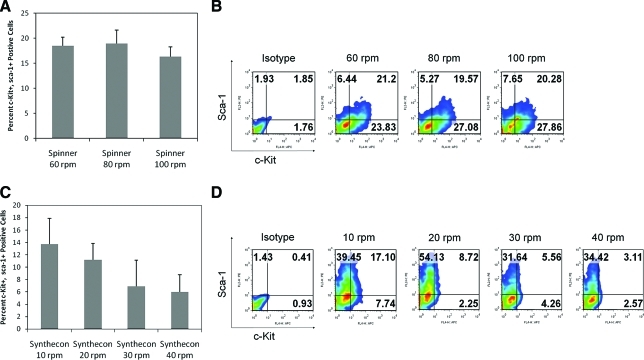
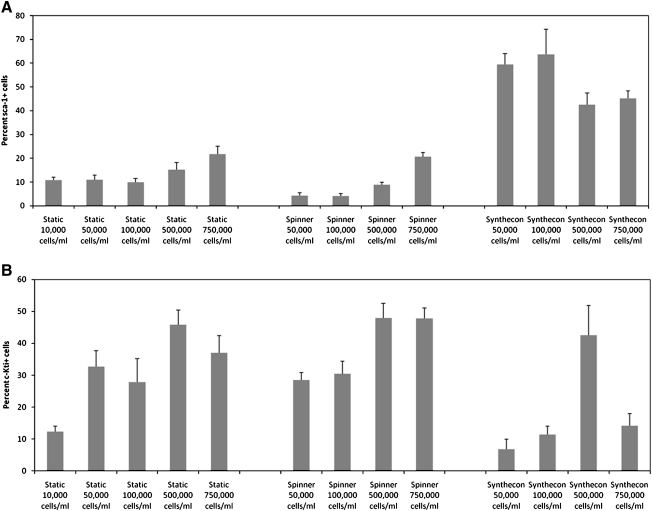
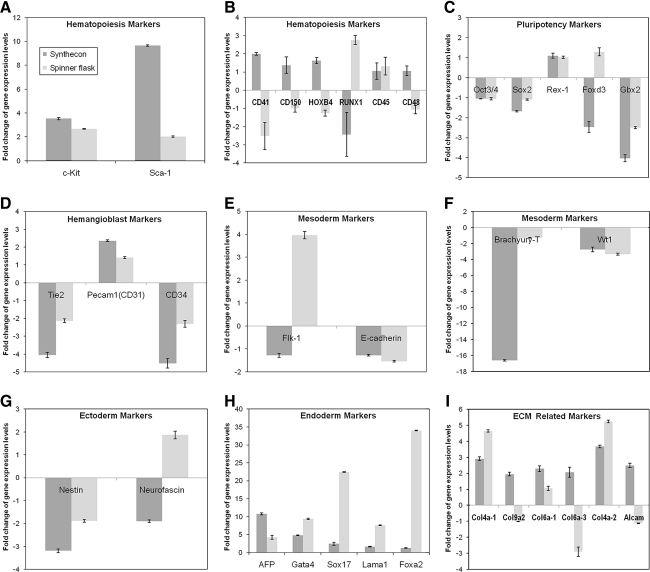
Embryonic stem (ES)-cell-derived lineage-specific stem cells, for example, hematopoietic stem cells, could provide a potentially unlimited source for transplantable cells, especially for cell-based therapies. However, reproducible methods must be developed to maximize and scale-up ES cell differentiation to produce clinically relevant numbers of therapeutic cells. Bioreactor-based dynamic culture conditions are amenable to large-scale cell production, but few studies have evaluated how various bioreactor types and culture parameters influence ES cell differentiation, especially hematopoiesis. Our results indicate that cell seeding density and bioreactor speed significantly affect embryoid body formation and subsequent generation of hematopoietic stem and progenitor cells in both stirred tank (spinner flask) and rotary microgravity (Synthecon™) type bioreactors. In general, high percentages of hematopoietic stem and progenitor cells were generated in both bioreactors, especially at high cell densities. In addition, Synthecon bioreactors produced more sca-1(+) progenitors and spinner flasks generated more c-Kit(+) progenitors, demonstrating their unique differentiation profiles. cDNA microarray analysis of genes involved in pluripotency, germ layer formation, and hematopoietic differentiation showed that on day 7 of differentiation, embryoid bodies from both bioreactors consisted of all three germ layers of embryonic development. However, unique gene expression profiles were observed in the two bioreactors; for example, expression of specific hematopoietic genes were significantly more upregulated in the Synthecon cultures than in spinner flasks. We conclude that bioreactor type and culture parameters can be used to control ES cell differentiation, enhance unique progenitor cell populations, and provide means for large-scale production of transplantable therapeutic cells.


Figures

FIG. 1.
FIG. 1.
EB pictures and number of embryoid bodies (EBs) in static (A), spinner flask (B), and Synthecon (C) suspension cultures with varying initial cell densities and rotation speeds at day 6 of differentiation. EBs appeared to increase in number as cell seeding density was increased. Scale bar is 630 μm.
FIG. 2.
FIG. 2.
Effect of initial embryonic stem (ES) cell concentration on average diameter and concentration of EB in static culture at varying cell densities (A–D), spinner flask at varying cell seeding densities (E–H) and speeds (I–L), and Synthecon at varying cell seeding densities (M–P) and speeds (Q–T). Static experiments were repeated a minimum of four times with three biological repeats with a minimum of 36 total fields of view for each condition. Spinner flask experiments were repeated a minimum of two times with three biological repeats with a minimum of 18 total fields of view for each condition. Synthecon experiments were repeated a minimum of three times with two biological repeats with a minimum of 24 total fields of view for each condition. Similar conditions from various experiments were combined for graphical representation. *p < 0.05 when compared to other conditions as indicated, and **p < 0.05 when compared to all other conditions on same day. Color images available online at www.liebertonline.com/ten.
FIG. 3.
FIG. 3.
Effect of initial ES cell concentration on size distribution of EBs in static culture at varying cell densities (A), spinner flask at varying cell seeding densities (B) and speeds (C), and Synthecon at varying cell seeding densities (D) and speeds (E). EBs were sorted into bins of 50 μm with a polynomial trendline shown. In general, the static system (A) showed least control over EB size, as demonstrated by the larger peak width. In the Synthecon system, higher rotation speeds demonstrate a trend of smaller EBs compared to lower rotation speeds (E). Color images available online at www.liebertonline.com/ten.
FIG. 4.
FIG. 4.
Percentage of cells positive for hematopoietic stem and progenitor cell markers c-Kit and sca-1 with varying initial ES cell concentration in static (A, B), spinner flask (C, D), and Synthecon (E, F) cultures. Cells from EBs at day 7 of differentiation were compared using flow cytometry. Static experiments were repeated a minimum of four times with three biological repeats. Spinner flask experiments were repeated a minimum of three times with three biological repeats. Synthecon experiments were repeated a minimum of four times with two biological repeats. Similar conditions from various experiments were combined for figures and statistical analysis. Final number of n after removal of outliers (in order of increasing cell density) were 34, 15, 15, 12, and 15 for static cultures; 9, 9, 9, and 23 for spinner flask cultures; and 7, 7, 8, and 15 for Synthecon cultures. *p < 0.05 when compared to lowest cell density, and **p < 0.05 when compared to all other conditions. Color images available online at www.liebertonline.com/ten.
FIG. 5.
FIG. 5.
Percentage of cells positive for hematopoietic stem and progenitor cells markers c-Kit and sca-1 with varying rotation speed in spinner flask (A, B) and Synthecon (C, D) cultures. Cells from EBs at day 7 of differentiation were compared using flow cytometry. Spinner flask experiments were repeated a minimum of three times with three biological repeats. Synthecon experiments were repeated a minimum of four times with two biological repeats. Similar conditions from various experiments were combined for figures and statistical analysis. Final number of n after removal of outliers (in order of increasing rotation speed) were 15, 15, and 23 for spinner flask cultures and 8, 15, 8, and 8 for Synthecon cultures. Color images available online at www.liebertonline.com/ten.
FIG. 6.
FIG. 6.
Percentage of cells positive for progenitor cell markers sca-1 (A) and c-Kit (B) with varying initial ES cell concentration in static, spinner flask, and Synthecon cultures. Cells from EBs at day 7 of differentiation were compared using flow cytometry. Static experiments were repeated a minimum of four times with three biological repeats. Spinner flask experiments were repeated a minimum of three times with three biological repeats. Synthecon experiments were repeated a minimum of four times with two biological repeats. Similar conditions from various experiments were combined for figures and statistical analysis. Final number of n after removal of outliers was a minimum of 7.
FIG. 7.
FIG. 7.
Percentage of cells positive for progenitor cell markers sca-1 (A) and c-Kit (B) with varying speed in spinner flask and Synthecon cultures. Cells from EBs at day 7 of differentiation were compared using flow cytometry. Spinner flask experiments were repeated a minimum of five times with three biological repeats. Synthecon experiments were repeated a minimum of four times with two biological repeats. Similar conditions from various experiments were combined for figures and statistical analysis. Final number of n after removal of outliers was a minimum of 7. All spinner flask conditions showed a statistically significant difference to all Synthecon cultures when comparing both c-Kit and sca-1.
FIG. 8.
FIG. 8.
Expression profile of specific genes differentially regulated in bioreactor culture conditions (Synthecon and spinner flask). Comparison of the expression levels (n = 3) of hematopoiesis markers (A, B), pluripotency and self-renewal markers (C), hemangioblast markers (D), germ layer markers of mesoderm (E, F), ectoderm (G), endoderm (H), and genes involved in extracellular matrix (ECM) production (I).

Similar articles

Cited by

References

    1. Sato N. Sanjuan I.M. Heke M. Uchida M. Naef F. Brivanlou A.H. Molecular signature of human embryonic stem cells and its comparison with the mouse. Dev Biol. 2003;260:404. - PubMed
    1. Kaji E.H. Leiden J.M. Gene and stem cell therapies. JAMA. 2001;285:545. - PubMed
    1. Storb R. Allogeneic hematopoietic stem cell transplantation—yesterday, today, and tomorrow. Exp Hematol. 2003;31:1. - PubMed
    1. Storb R. McSweeney P.A. Sandmaier B.M. Nash R.A. Georges G. Maloney D.G., et al. Allogeneic hematopoietic stem cell transplantation: from the nuclear age into the twenty-first century. Transplant Proc. 2000;32:2548. - PubMed
    1. Little M.T. Storb R. The future of allogeneic hematopoietic stem cell transplantation: minimizing pain, maximizing gain. J Clin Invest. 2000;105:1679. - PMC - PubMed

Publication types

MeSH terms