

The myeloperoxidase-derived oxidant HOSCN inhibits protein tyrosine phosphatases and modulates cell signalling via the mitogen-activated protein kinase (MAPK) pathway in macrophages
- PMID: 20528774
- PMCID: PMC2911680
- DOI: 10.1042/BJ20100082
The myeloperoxidase-derived oxidant HOSCN inhibits protein tyrosine phosphatases and modulates cell signalling via the mitogen-activated protein kinase (MAPK) pathway in macrophages
Abstract
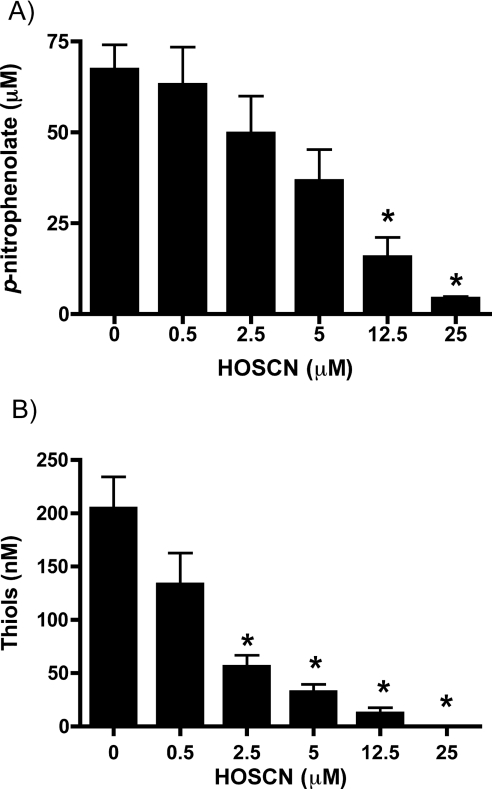
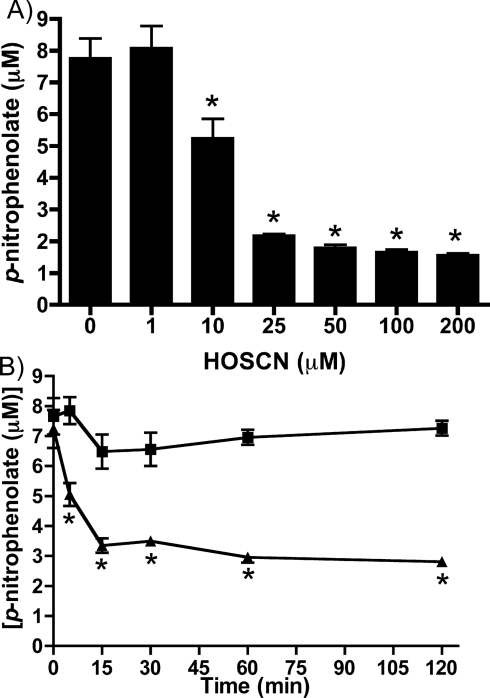
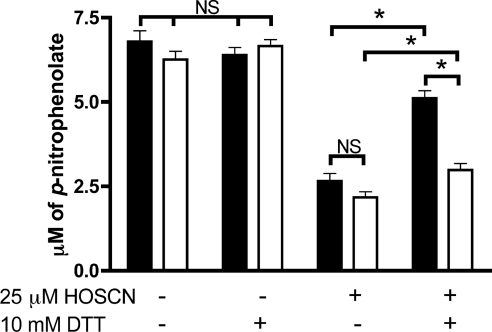
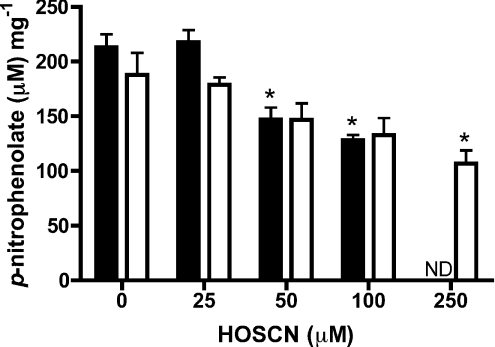
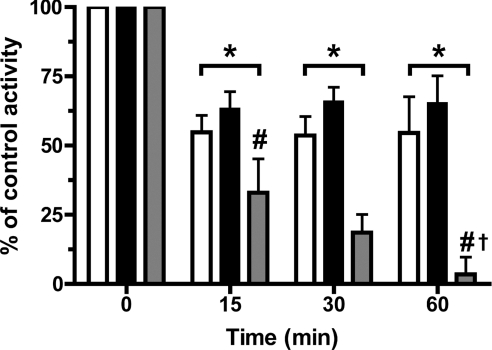
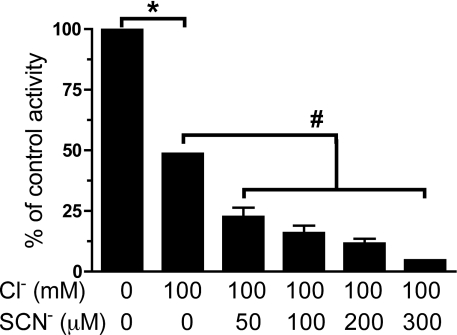
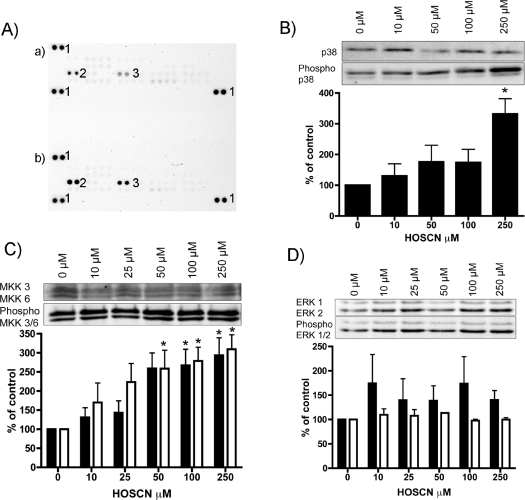
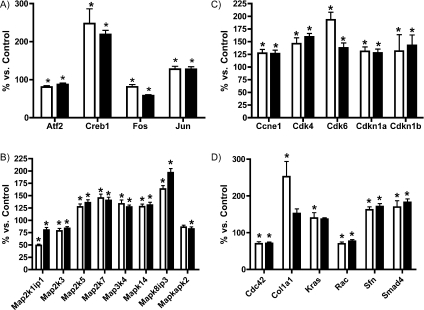
MPO (myeloperoxidase) catalyses the oxidation of chloride, bromide and thiocyanate by hydrogen peroxide to HOCl (hypochlorous acid), HOBr (hypobromous acid) and HOSCN (hypothiocyanous acid) respectively. Specificity constants indicate that SCN- is a major substrate for MPO. HOSCN is also a major oxidant generated by other peroxidases including salivary, gastric and eosinophil peroxidases. While HOCl and HOBr are powerful oxidizing agents, HOSCN is a less reactive, but more specific, oxidant which targets thiols and especially low pKa species. In the present study we show that HOSCN targets cysteine residues present in PTPs (protein tyrosine phosphatases) with this resulting in a loss of PTP activity for the isolated enzyme, in cell lysates and intact J774A.1 macrophage-like cells. Inhibition also occurs with MPO-generated HOCl and HOBr, but is more marked with MPO-generated HOSCN, particularly at longer incubation times. This inhibition is reversed by dithiothreitol, particularly at early time points, consistent with the reversible oxidation of the active site cysteine residue to give either a cysteine-SCN adduct or a sulfenic acid. Inhibition of PTP activity is associated with increased phosphorylation of p38a and ERK2 (extracellular-signal-regulated kinase 2) as detected by Western blot analysis and phosphoprotein arrays, and results in altered MAPK (mitogen-activated protein kinase) signalling. These data indicate that the highly selective targeting of some protein thiols by HOSCN can result in perturbation of cellular phosphorylation and altered cell signalling. These changes occur with (patho)physiological concentrations of SCN- ions, and implicate HOSCN as an important mediator of inflammation-induced oxidative damage, particularly in smokers who have elevated plasma levels of SCN-.
Figures
Similar articles
-
The myeloperoxidase-derived oxidant hypothiocyanous acid inhibits protein tyrosine phosphatases via oxidation of key cysteine residues.Free Radic Biol Med. 2016 Jan;90:195-205. doi: 10.1016/j.freeradbiomed.2015.11.025. Epub 2015 Nov 23. Free Radic Biol Med. 2016. PMID: 26616646
-
Hypothiocyanous acid reactivity with low-molecular-mass and protein thiols: absolute rate constants and assessment of biological relevance.Biochem J. 2009 Jul 29;422(1):111-7. doi: 10.1042/BJ20090276. Biochem J. 2009. PMID: 19492988
-
Hypothiocyanous acid is a more potent inducer of apoptosis and protein thiol depletion in murine macrophage cells than hypochlorous acid or hypobromous acid.Biochem J. 2008 Sep 1;414(2):271-80. doi: 10.1042/BJ20080468. Biochem J. 2008. PMID: 18459943
-
Reactions and reactivity of myeloperoxidase-derived oxidants: differential biological effects of hypochlorous and hypothiocyanous acids.Free Radic Res. 2012 Aug;46(8):975-95. doi: 10.3109/10715762.2012.667566. Epub 2012 Apr 23. Free Radic Res. 2012. PMID: 22348603 Review.
-
The therapeutic potential of thiocyanate and hypothiocyanous acid against pulmonary infections.Free Radic Biol Med. 2024 Jul;219:104-111. doi: 10.1016/j.freeradbiomed.2024.04.217. Epub 2024 Apr 11. Free Radic Biol Med. 2024. PMID: 38608822 Free PMC article. Review.
Cited by
-
Inactivation of thiol-dependent enzymes by hypothiocyanous acid: role of sulfenyl thiocyanate and sulfenic acid intermediates.Free Radic Biol Med. 2012 Mar 15;52(6):1075-85. doi: 10.1016/j.freeradbiomed.2011.12.024. Epub 2012 Jan 8. Free Radic Biol Med. 2012. PMID: 22248862 Free PMC article.
-
Biochemical mechanisms and therapeutic potential of pseudohalide thiocyanate in human health.Free Radic Res. 2015 Jun;49(6):695-710. doi: 10.3109/10715762.2014.1003372. Epub 2015 Jan 28. Free Radic Res. 2015. PMID: 25564094 Free PMC article. Review.
-
The Roles of Neutrophil-Derived Myeloperoxidase (MPO) in Diseases: The New Progress.Antioxidants (Basel). 2024 Jan 22;13(1):132. doi: 10.3390/antiox13010132. Antioxidants (Basel). 2024. PMID: 38275657 Free PMC article. Review.
-
Hypocrates is a genetically encoded fluorescent biosensor for (pseudo)hypohalous acids and their derivatives.Nat Commun. 2022 Jan 10;13(1):171. doi: 10.1038/s41467-021-27796-2. Nat Commun. 2022. PMID: 35013284 Free PMC article.
-
CVD and Oxidative Stress.J Clin Med. 2017 Feb 20;6(2):22. doi: 10.3390/jcm6020022. J Clin Med. 2017. PMID: 28230726 Free PMC article. Review.
References
-
- Davies M. J., Hawkins C. L., Pattison D. I., Rees M. D. Mammalian heme peroxidases: from molecular mechanisms to health implications. Antioxid. Redox Signaling. 2008;10:1199–1234. - PubMed
-
- Klebanoff S. J. Myeloperoxidase: friend and foe. J. Leukocyte Biol. 2005;77:598–625. - PubMed
-
- Kettle A. J., Winterbourn C. C. Myeloperoxidase: a key regulator of neutrophil oxidant production. Redox Rep. 1997;3:3–15. - PubMed
-
- Lentner C. Basle: Ciba-Geigy Ltd; 1984. Geigy Scientific Tables: Physical Chemistry, Composition of Blood, Hematology, Somatometric Data.
Publication types
MeSH terms
Substances
LinkOut - more resources
Full Text Sources
Medical
Research Materials
Miscellaneous