

The calcineurin inhibitor tacrolimus allows the induction of functional CD4CD25 regulatory T cells by rabbit anti-thymocyte globulins
- PMID: 20528886
- PMCID: PMC2909420
- DOI: 10.1111/j.1365-2249.2010.04183.x
The calcineurin inhibitor tacrolimus allows the induction of functional CD4CD25 regulatory T cells by rabbit anti-thymocyte globulins
Abstract
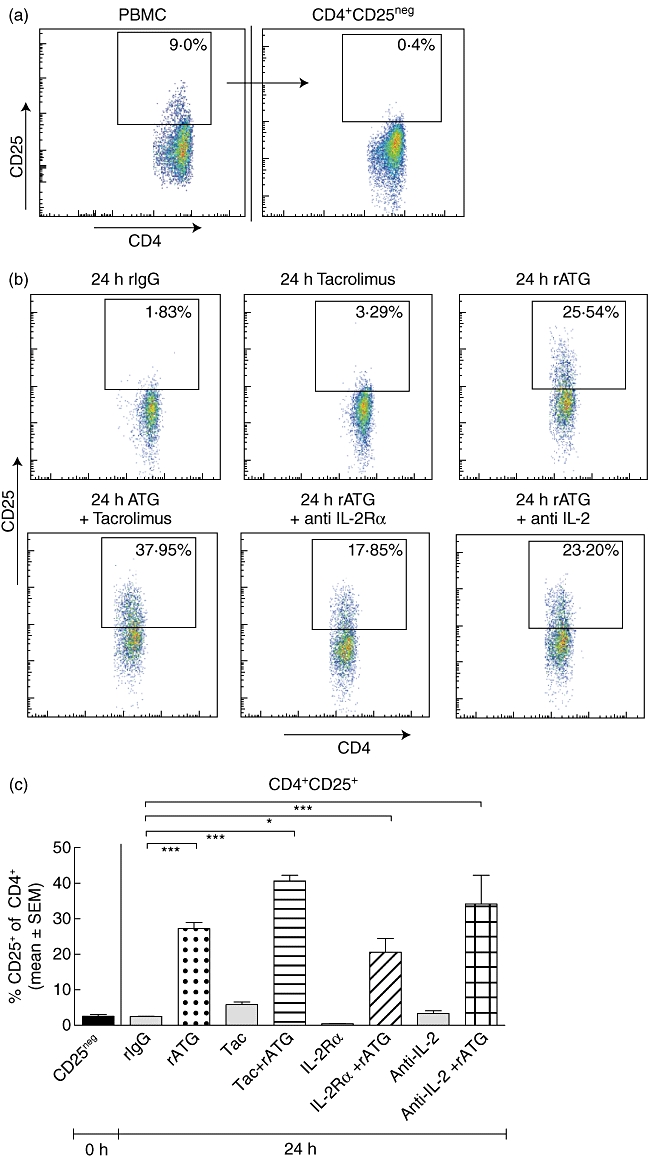
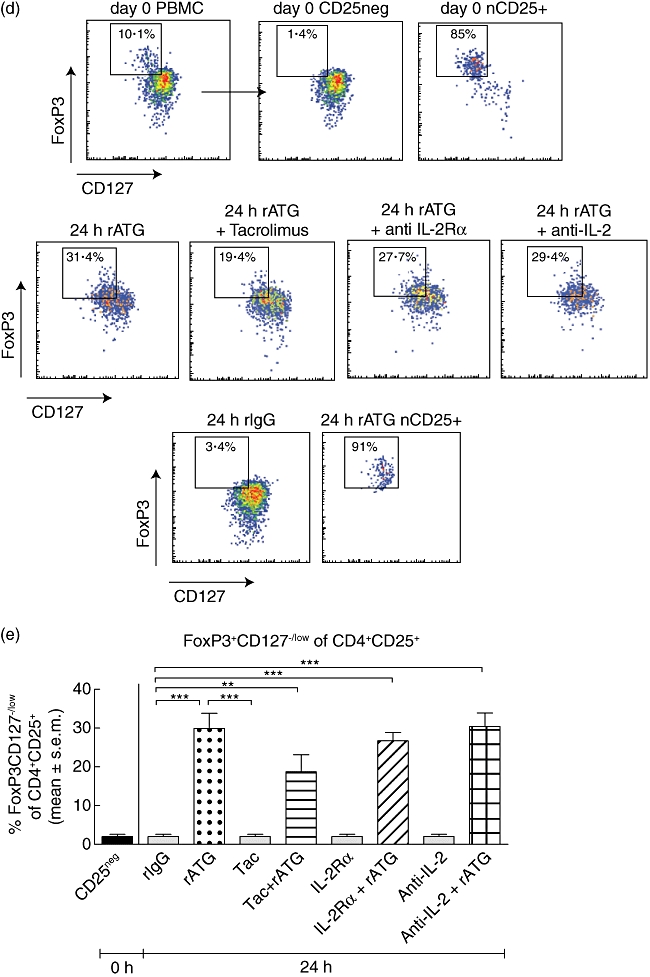
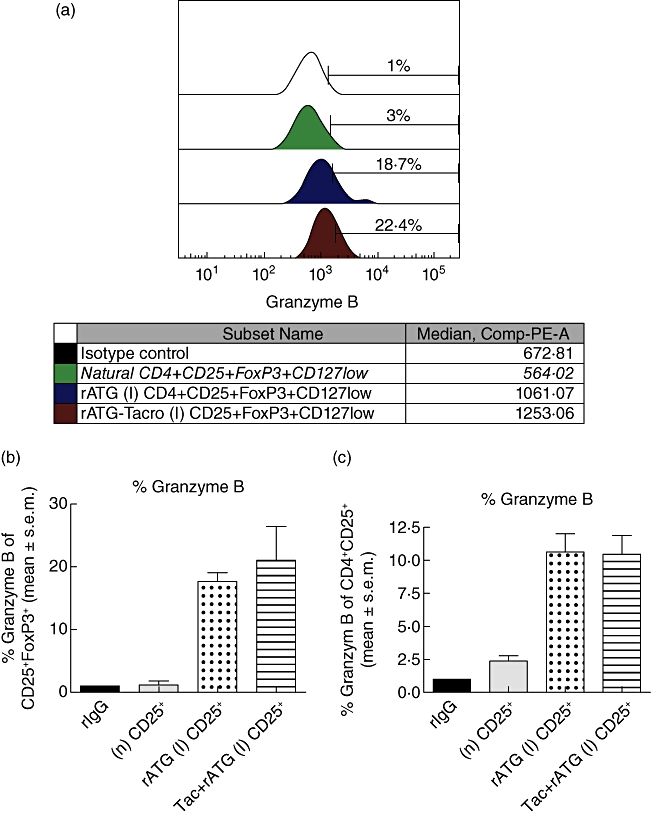
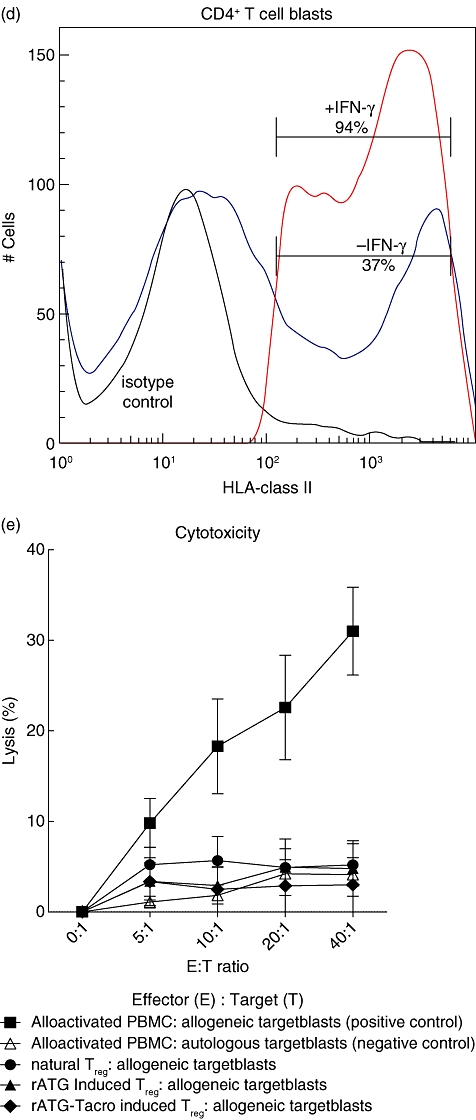
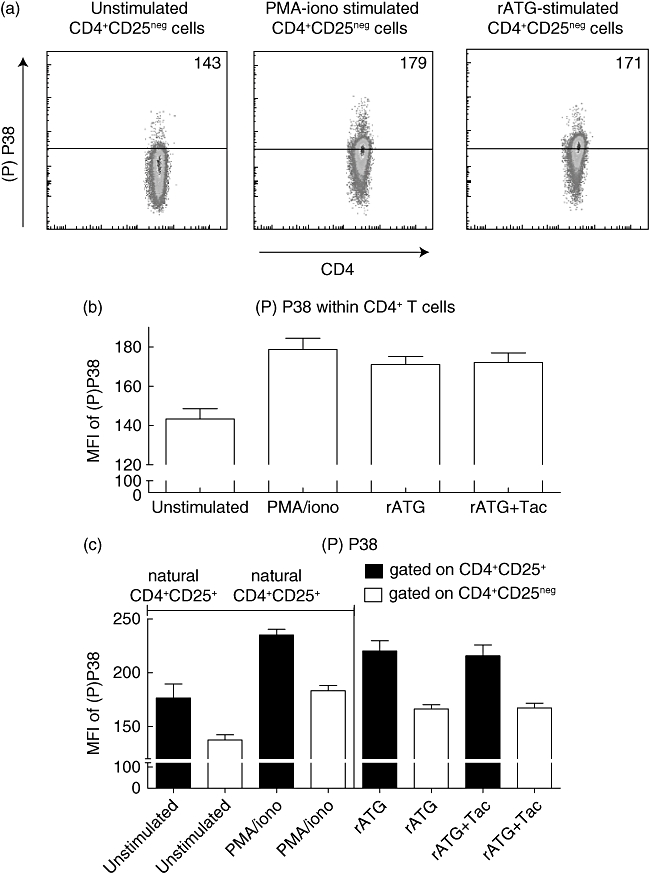
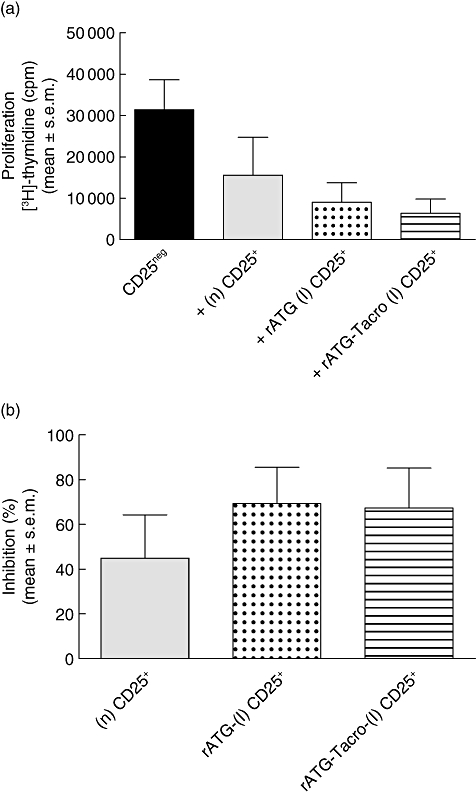
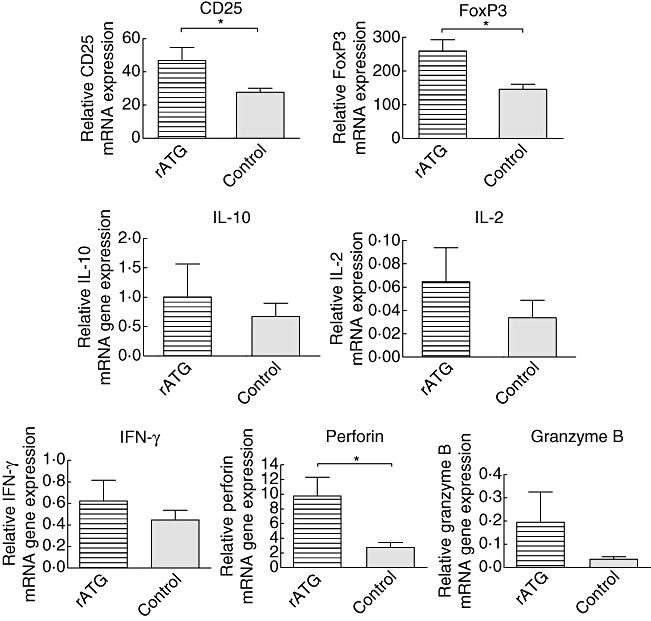
Rabbit anti-thymocyte globulins (rATG) induce CD4(+)CD25(+)forkhead box P3 (FoxP3(+)) regulatory T cells that control alloreactivity. In the present study, we investigated whether rATG convert T cells into functional CD4(+)CD25(+)FoxP3(+)CD127(-/low) regulatory T cells in the presence of drugs that may hamper their induction and function, i.e. calcineurin inhibitors. CD25(neg) T cells were stimulated with rATG or control rabbit immunoglobulin G (rIgG) in the absence and presence of tacrolimus for 24 h. Flow cytometry was performed for CD4, CD25, FoxP3 and CD127 and the function of CD25(+) T cells was examined in suppression assays. MRNA expression profiles were composed to study the underlying mechanisms. After stimulation, the percentage CD4(+)CD25(+)FoxP3(+)CD127(-/low) increased (from 2% to 30%, mean, P < 0.01) and was higher in the rATG samples than in control rIgG samples (2%, P < 0.01). Interestingly, FoxP3(+)T cells were also induced when tacrolimus was present in the rATG cultures. Blockade of the interleukin (IL)-2 pathway did not affect the frequency of rATG-induced FoxP3(+) T cells. The rATG tacrolimus-induced CD25(+) T cells inhibited proliferative responses of alloantigen-stimulated effector T cells as vigorously as rATG-induced and natural CD4(+)CD25(+)FoxP3(+)CD127(-/low) T cells (67% +/- 18% versus 69% +/- 16% versus 45% +/- 20%, mean +/- standard error of the mean, respectively). At the mRNA-expression level, rATG-induced CD25(+) T cells abundantly expressed IL-10, IL-27, interferon (IFN)-gamma, perforin and granzyme B in contrast to natural CD25(+) T cells (all P = 0.03), while FoxP3 was expressed at a lower level (P = 0.03). These mRNA data were confirmed in regulatory T cells from kidney transplant patients. Our findings demonstrate that tacrolimus does not negatively affect the induction, phenotype and function of CD4(+)CD25(+) T cells, suggesting that rATG may induce regulatory T cells in patients who receive tacrolimus maintenance therapy.
Figures

Similar articles
-
Characterization of rabbit antithymocyte globulins-induced CD25+ regulatory T cells from cells of patients with end-stage renal disease.Transplantation. 2010 Mar 27;89(6):655-66. doi: 10.1097/TP.0b013e3181c9cc7a. Transplantation. 2010. PMID: 20164820
-
The effect of rabbit anti-thymocyte globulin induction therapy on regulatory T cells in kidney transplant patients.Nephrol Dial Transplant. 2009 May;24(5):1635-44. doi: 10.1093/ndt/gfn778. Epub 2009 Jan 28. Nephrol Dial Transplant. 2009. PMID: 19176684 Clinical Trial.
-
Interleukin-7 matures suppressive CD127(+) forkhead box P3 (FoxP3)(+) T cells into CD127(-) CD25(high) FoxP3(+) regulatory T cells.Clin Exp Immunol. 2011 Jul;165(1):60-76. doi: 10.1111/j.1365-2249.2011.04334.x. Epub 2011 Mar 17. Clin Exp Immunol. 2011. PMID: 21413939 Free PMC article.
-
Forkhead box P3: the peacekeeper of the immune system.Int Rev Immunol. 2014 Mar;33(2):129-45. doi: 10.3109/08830185.2013.863303. Epub 2013 Dec 19. Int Rev Immunol. 2014. PMID: 24354325 Review.
-
Regulatory T cell in stroke: a new paradigm for immune regulation.Clin Dev Immunol. 2013;2013:689827. doi: 10.1155/2013/689827. Epub 2013 Aug 4. Clin Dev Immunol. 2013. PMID: 23983771 Free PMC article. Review.
Cited by
-
Low-Dose Tacrolimus Prevents Dysregulated Peri-Conceptional Ovarian and Systemic Immune Cellular Homeostasis in Subjects with PCOS.Sci Rep. 2019 Apr 25;9(1):6528. doi: 10.1038/s41598-019-42960-x. Sci Rep. 2019. PMID: 31024070 Free PMC article.
-
Long-term lung transplantation in nonhuman primates.Am J Transplant. 2015 May;15(5):1415-20. doi: 10.1111/ajt.13130. Epub 2015 Mar 13. Am J Transplant. 2015. PMID: 25772308 Free PMC article.
-
FoxP3 T cells and the pathophysiologic effects of brain death and warm ischemia in donor kidneys.Clin J Am Soc Nephrol. 2012 Sep;7(9):1481-9. doi: 10.2215/CJN.13041211. Epub 2012 Jun 28. Clin J Am Soc Nephrol. 2012. PMID: 22745276 Free PMC article.
-
Immune responses against islet allografts during tapering of immunosuppression--a pilot study in 5 subjects.Clin Exp Immunol. 2012 Aug;169(2):190-8. doi: 10.1111/j.1365-2249.2012.04605.x. Clin Exp Immunol. 2012. PMID: 22774994 Free PMC article.
-
Regulatory T cell induction, migration, and function in transplantation.J Immunol. 2012 Nov 15;189(10):4705-11. doi: 10.4049/jimmunol.1202027. J Immunol. 2012. PMID: 23125426 Free PMC article. Review.
References
-
- Waldmann H, Adams E, Fairchild P, Cobbold S. Infectious tolerance and the long-term acceptance of transplanted tissue. Immunol Rev. 2006;212:301–13. - PubMed
-
- Bloom DD, Chang Z, Fechner JH, et al. CD4+CD25+FOXP3+ regulatory T cells increase de novo in kidney transplant patients after immunodepletion with Campath-1H. Am J Transplant. 2008;8:793–802. - PubMed
-
- Battaglia M, Stabilini A, Draghici E, et al. Rapamycin and interleukin-10 treatment induces T regulatory type 1 cells that mediate antigen-specific transplantation tolerance. Diabetes. 2006;55:40–9. - PubMed
-
- Lopez M, Clarkson MR, Albin M, Sayegh MH, Najafian N. A novel mechanism of action for anti-thymocyte globulin: induction of CD4+CD25+Foxp3+ regulatory T cells. J Am Soc Nephrol. 2006;17:2844–53. - PubMed
MeSH terms
Substances
LinkOut - more resources
Full Text Sources
Other Literature Sources
Research Materials
