. 2010 Jun;31(12):2234-46.
doi: 10.1111/j.1460-9568.2010.07292.x. Epub 2010 Jun 7.

Distinct synaptic properties of perisomatic inhibitory cell types and their different modulation by cholinergic receptor activation in the CA3 region of the mouse hippocampus

Affiliations
Free PMC article

Distinct synaptic properties of perisomatic inhibitory cell types and their different modulation by cholinergic receptor activation in the CA3 region of the mouse hippocampus

Gergely G Szabó et al. Eur J Neurosci. 2010 Jun.
Free PMC article

Abstract

Perisomatic inhibition originates from three types of GABAergic interneurons in cortical structures, including parvalbumin-containing fast-spiking basket cells (FSBCs) and axo-axonic cells (AACs), as well as cholecystokinin-expressing regular-spiking basket cells (RSBCs). These interneurons may have significant impact in various cognitive processes, and are subjects of cholinergic modulation. However, it is largely unknown how cholinergic receptor activation modulates the function of perisomatic inhibitory cells. Therefore, we performed paired recordings from anatomically identified perisomatic interneurons and pyramidal cells in the CA3 region of the mouse hippocampus. We determined the basic properties of unitary inhibitory postsynaptic currents (uIPSCs) and found that they differed among cell types, e.g. GABA released from axon endings of AACs evoked uIPSCs with the largest amplitude and with the longest decay measured at room temperature. RSBCs could also release GABA asynchronously, the magnitude of the release increasing with the discharge frequency of the presynaptic interneuron. Cholinergic receptor activation by carbachol significantly decreased the uIPSC amplitude in all three types of cell pairs, but to different extents. M2-type muscarinic receptors were responsible for the reduction in uIPSC amplitudes in FSBC- and AAC-pyramidal cell pairs, while an antagonist of CB(1) cannabinoid receptors recovered the suppression in RSBC-pyramidal cell pairs. In addition, carbachol suppressed or even eliminated the short-term depression of uIPSCs in FSBC- and AAC-pyramidal cell pairs in a frequency-dependent manner. These findings suggest that not only are the basic synaptic properties of perisomatic inhibitory cells distinct, but acetylcholine can differentially control the impact of perisomatic inhibition from different sources.


Figures

Fig. 7
Fig. 7
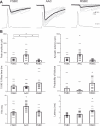
Synaptic cross-talk between release sites of AACs, but not those of FSBCs, may explain the differences in decay kinetics. (A) Two representative superimposed IPSCs originating from an AAC–pyramidal cell pair in control conditions (ctr) and in the presence of carbachol (CCh). Dashed lines represent the exponential fits while the horizontal line illustrates the decay width at 50% (T50) of the peak amplitude. Note that the traces are normalized in order to visualize the changes in the decay. Original traces are shown in the inserts. (B) Same as in A, but with uIPSCs originating from an FSBC cell. (C) Summary of changes in decay time constants (τ) and T50 values at AAC–pyramidal cell pairs in response to carbachol. (D) Same as in C, but for FSBC–pyramidal cell pairs. Each data point represents a cell pair in the line series. Data calculated from seven paired recordings in each case; *P < 0.01.
Fig. 1
Fig. 1
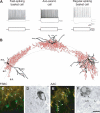
Electrophysiological and morphological properties of the three types of perisomatic inhibitory interneurons in the CA3 region of the mouse hippocampus. (A) Firing characteristics of three representative cells in response to depolarizing and hyperpolarizing current steps of 400 pA and −100 pA, respectively. (B) Camera lucida reconstructions of representative biocytin-loaded neurons. Left, fast-spiking basket cell (FSBC); middle, axo-axonic cell (AAC); right, regular-spiking basket cell (RSBC). Cell bodies and dendrites of interneurons are shown in black and axon clouds in red. (C) Double immunofluorescent labelling for biocytin (green; arrowheads point to labelled terminals) and for ankyrin-G (yellow; arrowheads point to labelled AISs) shows no close appositions of biocytin-filled boutons with AISs. (D) An electron micrograph of a peroxidase-labelled axon terminal of the same cell as in C illustrates that this bouton formed symmetrical synapses (arrow) on CA3 pyramidal cell soma(s), a characteristic of basket cells. (E) Double immunofluorescent labelling as in C shows tight appositions of biocytin-labelled boutons (green; arrowheads) and ankyrin-G-labelled AISs (yellow; arrows), suggesting that this neuron is an AAC. (F) An electron micrograph of a peroxidase-labelled axon ending of the same cell as in E confirms that this interneuron formed synapses (arrow) on AISs of CA3 pyramidal cells, indicating that the recorded neuron was an AAC. Arrowheads show undercoating, characteristic of AISs. Scale bar in F, 100 μm (B), 15 μm (C and E) and 0.5 μm (D and F).
Fig. 2
Fig. 2
Basic properties of synaptic communication between perisomatic inhibitory interneurons and pyramidal cells. (A) Ten superimposed uIPSCs (thin lines) evoked by single presynaptic action potentials in representative FSBC–, AAC– and RSBC–pyramidal cell pairs. Averages of uIPSCs are indicated by thick black lines. (B) Comparison of the peak amplitude, the synaptic potency, the 10–90% rise time, the failure probability, the half-decay (T50) and the latency obtained in the three types of perisomatic inhibitory interneurons and pyramidal cell pairs. Bars show the averages and short lines show the mean values for individual cell pairs. Asterisks indicate significant differences (see Table 1).
Fig. 3
Fig. 3
Cell-type-specific suppression of uIPSC amplitudes by the ACh receptor agonist carbachol. (A) Representative experiments obtained in FSBC–, AAC– and RSBC–pyramidal cell pairs. In each case, bath application of 5 μm carbachol suppressed the uIPSC amplitude. In FSBC– and AAC–pyramidal cell pairs the reduction in the peak amplitude could be restored by an M2-receptor-preferring antagonist AF/DX 116 (10 μm), while a CB1 cannabinoid receptor antagonist AM251 (1 μm) reversed the suppression of uIPSC amplitude in RSBC–pyramidal cell pairs. (B) Average of five uIPSCs evoked by single presynaptic action potentials taken at the labelled time points. (C) Summary data of all pairs. Each square represents a mean value of IPSC amplitude from individual cell pairs under a given condition. Asterisks indicate the significant differences. Note the different scales on y axis.
Fig. 5
Fig. 5
Frequency-dependent changes in short-term plasticity of synaptic transmission in FSBC– and AAC–pyramidal cell pairs. (A) Ratio of IPSC10/IPSC1 is shown at different frequency values at FSBC–pyramidal cell pairs. (B) Same as in A, but for AAC–pyramidal cell pairs. Solid squares and circles represent control conditions, open symbols show data from carbachol-treated slices. All data are from 14 FSBC– and 17 AAC–pyramidal cell pairs; *P < 0.05.
Fig. 4
Fig. 4
Carbachol changed the short-term dynamics of transmitter release. (A) Representative averaged IPSCs in response to 10 action potentials at a frequency of 30 Hz in control conditions. (B) Responses in the same pairs in the presence of 5 μm carbachol. (C) Summary of changes in release dynamics effected by carbachol at 30 Hz recorded in FSBC– (n = 14), AAC– (n = 17) and RSBC–pyramidal cell pairs (n = 14). Filled squares represent normalized peak amplitudes in control conditions, circles show the same in carbachol, and triangles show data obtained in carbachol that were normalized to the first IPSC amplitude in carbachol. Amplitudes are plotted against time during trains. Curves represent exponential fit to control data points. Note that RSBC data were unsuitable for fitting with exponentials because of the lack of short-term plasticity.
Fig. 6
Fig. 6
Asynchronous transmitter release in perisomatic inhibitory interneuron–pyramidal cell pairs. Examples of IPSC trains in response to 10 action potentials evoked at (A) 10 Hz and at (B) 30 Hz in an RSBC–pyramidal cell pair, and (C) at 30 Hz in an AAC–pyramidal cell pair. Averages are shown in black and the individual traces in grey. The magnified 100-ms-long periods before and after the action potential trains were compared to estimate the amount of asynchronous release, demonstrating the presence of asynchronous release in the RSBC–pyramidal cell pair only at 30 Hz. (D) Summary of the frequency-dependent asynchronous release in RSBC–pyramidal cell pairs. A significant asynchronous release was found at 15 and 30 Hz (*P < 0.05 and **P < 0.001, respectively). (E) Summary of asynchronous release in the three types of perisomatic inhibitory interneuron–pyramidal cell pairs at the discharge frequency of 30 Hz.

Similar articles

Cited by

References

    1. Aronstam RS, Narayanan TK. Temperature effect on the detection of muscarinic receptor-G protein interactions in ligand binding assays. Biochem. Pharmacol. 1988;37:1045–1049. - PubMed
    1. Bartos M, Vida I, Frotscher M, Meyer A, Monyer H, Geiger JR, Jonas P. Fast synaptic inhibition promotes synchronized gamma oscillations in hippocampal interneuron networks. Proc. Natl Acad. Sci. USA. 2002;99:13222–13227. - PMC - PubMed
    1. Behrends JC, ten Bruggencate G. Cholinergic modulation of synaptic inhibition in the guinea pig hippocampus in vitro: excitation of GABAergic interneurons and inhibition of GABA-release. J. Neurophysiol. 1993;69:626–629. - PubMed
    1. Binda F, Bossi E, Giovannardi S, Forlani G, Peres A. Temperature effects on the presteady-state and transport-associated currents of GABA cotransporter rGAT1. FEBS Lett. 2002;512:303–307. - PubMed
    1. Biro AA, Holderith NB, Nusser Z. Release probability-dependent scaling of the postsynaptic responses at single hippocampal GABAergic synapses. J. Neurosci. 2006;26:12487–12496. - PMC - PubMed

Publication types

MeSH terms