

Postnatal development of collagen structure in ovine articular cartilage
- PMID: 20529268
- PMCID: PMC2906441
- DOI: 10.1186/1471-213X-10-62
Postnatal development of collagen structure in ovine articular cartilage
Abstract
Background: Articular cartilage (AC) is the layer of tissue that covers the articulating ends of the bones in diarthrodial joints. Across species, adult AC shows an arcade-like structure with collagen predominantly perpendicular to the subchondral bone near the bone, and collagen predominantly parallel to the articular surface near the articular surface. Recent studies into collagen fibre orientation in stillborn and juvenile animals showed that this structure is absent at birth. Since the collagen structure is an important factor for AC mechanics, the absence of the adult Benninghoff structure has implications for perinatal AC mechanobiology. The current objective is to quantify the dynamics of collagen network development in a model animal from birth to maturity. We further aim to show the presence or absence of zonal differentiation at birth, and to assess differences in collagen network development between different anatomical sites of a single joint surface. We use quantitative polarised light microscopy to investigate properties of the collagen network and we use the sheep (Ovis aries) as our model animal.
Results: Predominant collagen orientation is parallel to the articular surface throughout the tissue depth for perinatal cartilage. This remodels to the Benninghoff structure before the sheep reach sexual maturity. Remodelling of predominant collagen orientation starts at a depth just below the future transitional zone. Tissue retardance shows a minimum near the articular surface at all ages, which indicates the presence of zonal differentiation at all ages. The absolute position of this minimum does change between birth and maturity. Between different anatomical sites, we find differences in the dynamics of collagen remodelling, but no differences in adult collagen structure.
Conclusions: The collagen network in articular cartilage remodels between birth and sexual maturity from a network with predominant orientation parallel to the articular surface to a Benninghoff network. The retardance minimum near, but not at, the articular surface at all ages shows that a zonal differentiation is already present in the perinatal animals. In these animals, the zonal differentiation can not be correlated to the collagen network orientation. We find no difference in adult collagen structure in the nearly congruent metacarpophalangeal joint, but we do find differences in the dynamics of collagen network remodelling.
Figures
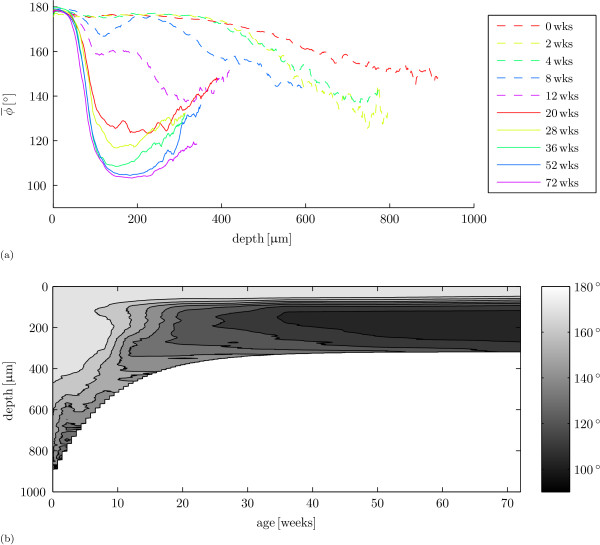
 as a function of age and cartilage depth. Colours represent age in weeks. (b) Overview of the results per age in a contour plot.
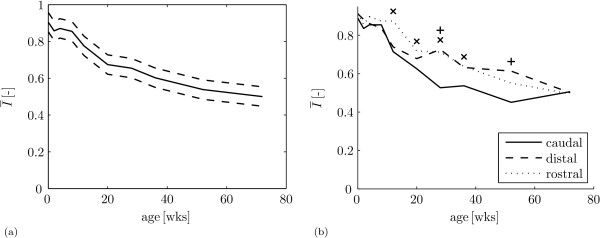
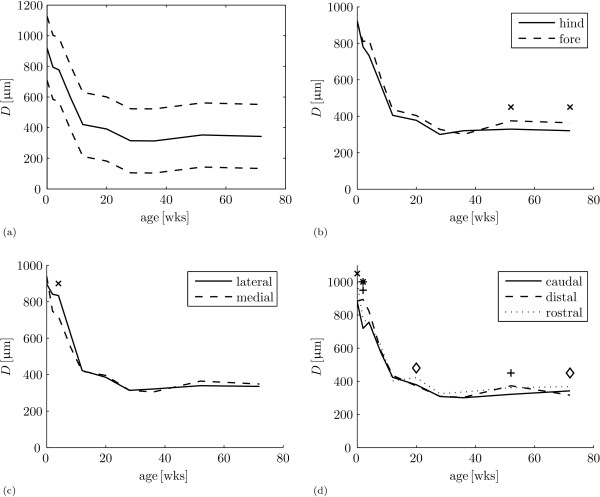
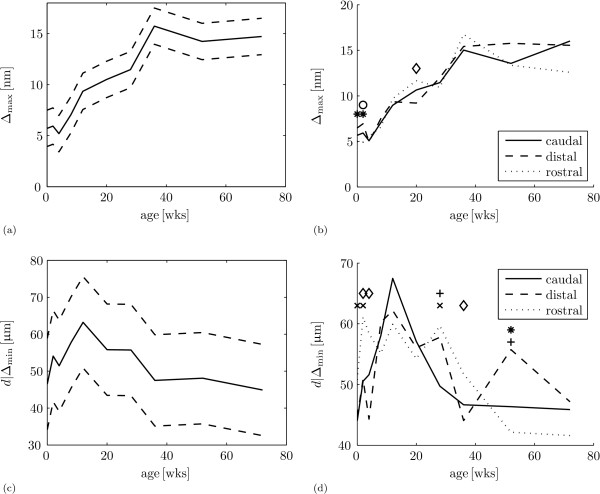
 (solid) ± standard deviation (dashed) as a function of age. (b) Mean orientation index as a function of age for the caudal site (solid), distal site (dashed) and rostral site (dotted). The model predicts significant differences for: 'x' - rostral site > caudal site and '+' - distal site > caudal site.
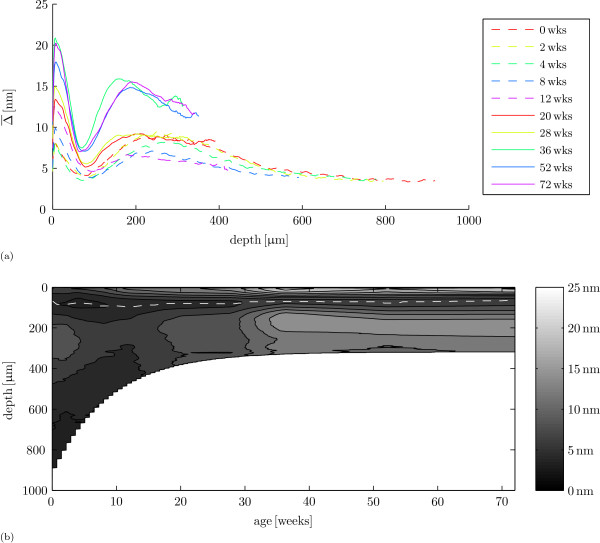
References
-
- Hunziker E, Kapfinger E, Geiss J. The structural architecture of adult mammalian articular cartilage evolves by a synchronized process of tissue resorption and neoformation during postnatal development. Osteoarthritis & Cartilage. 2007;15(4):403–413. doi: 10.1016/j.joca.2006.09.010. [Corrigendum in Osteoarthritis & Cartilage 15 (2007) 403-413.] - DOI - PubMed
MeSH terms
Substances
LinkOut - more resources
Full Text Sources
