. 2010 Jun 8:10:58.
doi: 10.1186/1471-230X-10-58.

Effects of mannoprotein E1 in liquid diet on inflammatory response and TLR5 expression in the gut of rats infected by Salmonella typhimurium

Affiliations

Effects of mannoprotein E1 in liquid diet on inflammatory response and TLR5 expression in the gut of rats infected by Salmonella typhimurium

Sinforiano J Posadas et al. BMC Gastroenterol. .

Abstract

Background: Mannoproteins are yeast cell wall componend, and rich in mannose. The use of foods rich in mannose as carbohydrate, could have a bioprotective effect against entrobacteria intestinal infection. Nothing is known about mannoproteins' activity in inflammatory bowel processes induced by entrobacteria.This study investigates the effects of mannoprotein administration via a liquid diet on inflammatory response and TLR5 expression during intestinal tissue injury in a rat model of infection with Salmonella typhimurium.

Methods: Adult Wistar male rats were divided into three groups: control, and mannoprotein E1 at 10 or 15%. Animals were fed with a liquid diet supplemented or not with mannoprotein E1. Groups were infected by intragastrical administration of S. typhimurium. 24 h post-inoculation samples of spleen, ileum and liver were collected for microbiological studies. Gut samples were processed to determine levels of proinflammatory cytokines (mRNA) and TLR5 (mRNA and protein) by quantitative PCR and Western-blot, and the number of proliferative and apoptotic cells determined by immunohistochemistry.

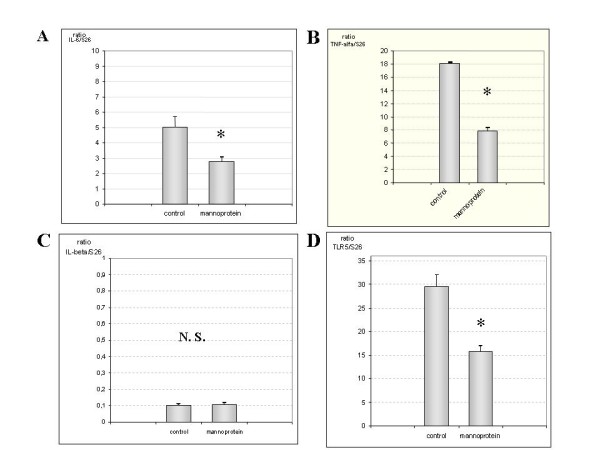
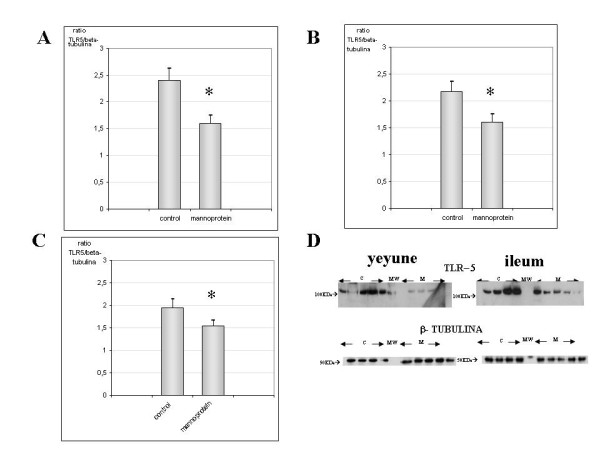
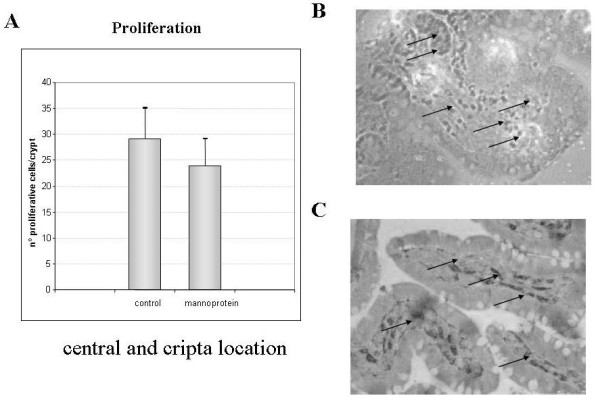
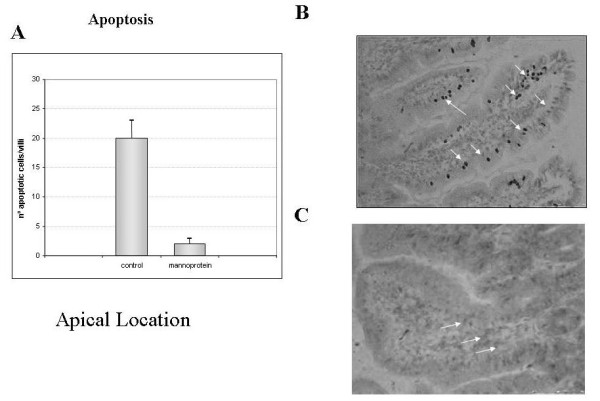
Results: Ininfected levels of proinflammatory cytokines and TLR5 were higher in untreated controls than in the animals receiving mannoprotein. Proliferation was similar in both groups, whereas apoptosis was higher in controls. Curiosly, the mannoprotein effect was dose dependent.

Conclusions: Mannoprotein administration in a liquid diet seems to protect intestinal tissue against S. typhimurium infection. This protection seems to expressed as a lower pro-inflammatory response and TLR5 downregulation in gut epithelium, as well as by an inhibition of apoptosis. Nevertheless, the molecular mechanism by which mannoprotein is able to regulate these responses remain unclear. These results could open up new avenues in the use of mannoproteins as prebiotics in the therapeutic strategy for treatment of inflammatory gut processes induced by microbia.


Figures

Figure 1
Figure 1
Quantification of IL-6, TNF-α, IL-1β and TLR5 mRNA in jejune samples. Figure 1A and 1B illustrate in a bar diagrams that IL-6 and TNF-α mRNA expression increased markedly in control group compared with mannoprotein. Figure 1C shows IL-1β mRNA expression in both groups represented as bars diagram (n = 9 control group, n = 8 mannoprotein group). No statistical differences were observed between both groups. Finally, figure 1D shows the results for TLR5 gene expression in both groups with augmented levels in the control group compared with mannoprotein. Error bars represent the standard deviations. * Significant at p > 0.05 compared with control.
Figure 2
Figure 2
Quantification of IL-6, TNF-α, IL-1β and TLR5 mRNA in Ileum samples. Figure 2A and 2B illustrate in a bar diagram that IL-6 and TNF-α mRNA expression increased markedly in control group compared with mannoprotein(n = 9 control group, n = 8 mannoprotein group). Figure 2C shows IL-1β mRNA expression in both groups represented as a bar diagram, with higher and significant levels in the controls. Finally, figure 2D shows the results for TLR5 gene expression in both groups with no differences in the control group compared with mannoprotein. Error bars represent the standard deviations. * Significant at p < 0.05 compared with control.
Figure 3
Figure 3
Quantification of IL-6, TNF-α, IL-1β and TLR5 mRNA in colon samples. Figure 3A and 3B illustrate in a bar diagram that IL-6 and TNF-α mRNA expression increased markedly in control group compared with mannoprotein (n = 9 control group, n = 8 mannoprotein group). Figure 3C shows IL-1β mRNA expression in both groups represented as a bar diagram. No statistical differences were observed between both groups. Finally figure 3D shows the results for TLR5 gene expression in both groups with augmented levels in the control group compared with mannoprotein. Error bars represent the standard deviations. * Significant at p < 0.05 compared with control.
Figure 4
Figure 4
Quantification of TLR5 protein levels in yeyune, Ileum and colon samples., Figure 4A, 4B and 4C show the levels of TLR5 protein expression in both groups for yeyune, ileum and colon respectively. In all figures an augmented expression of TLR5 is observed in the control group compared with mannoprotein (n = 9 control group, n = 8 mannoprotein group). These differences were statistically significant. Figure 4D shows a representative Western-blot picture of TLR5 and β-tubuline in yeyune (left) and Ileum (right) for both groups controls (designed as C) and mannoprotein (designed as M). Error bars represent the standard deviations. * Significant at p < 0.05 compared with control.
Figure 5
Figure 5
Number of total proliferative immunoreactive cells in ileum crypts and villi. Figure 5A shows the number of total proliferative positive cells in both groups analyzed as a bar diagram. Non statistical differences were found between controls and mannoprotein group. Figure 5B shows immunohistochemical location of proliferative cells in Ileum crypt in control. Figure 5C shows immunohistochemical location of proliferative cells in crypt villi in mannoprotein. Arrows indicate proliferative positive cells predominantly located in central villi and crypta. Photomicrographs at original magnification 20x. Error bars represent the standard deviations. * Significant at p < 0.05 compared with control group.
Figure 6
Figure 6
Number of total apoptotic immunoreactive cells in ileum villi. Figure 6A shows the number of total apoptotic positive cells in both groups analyzed as a bar diagram. Significant statistical differences were found between controls and mannoprotein group. Figure 6B shows immunohistochemical location of apoptotic cells in Ileum villi in control. Figure 6C shows immunohistochemical location of apoptotic cells in Ileum villi in mannoprotein. Arrows indicate proliferative positive cells predominantly located in apical. Photomomicrographs in original magnification 20x. Error bars represent the standard deviations. * Significant at p < 0.05 compared with control group.

References

    1. Tauxe R, Pavia A. Bacterial infections in humans: epidemiology and control. New York: Plenum; 1998. Salmonellosis: nontyphoidal; pp. 613–630.
    1. Wick MJ. Living in the danger zone: innate immunity to Salmonella. Curr Opin Microbiol. 2004;7:51–57. doi: 10.1016/j.mib.2003.12.008. - DOI - PubMed
    1. Strober W. Interactions between epithelial cells and immune cells in the intestine. Ann N Y Acad Sci. 1998;859:37–45. doi: 10.1111/j.1749-6632.1998.tb11109.x. - DOI - PubMed
    1. Hecht G. Innate mechanisms of epithelial host defense: spotlight on intestine. Am J Physiol. 1999;277:C351–C358. - PubMed
    1. Fierer J, Eckmann L, Kagnoff M. IL-8 secreted by epithelial cells invaded by bacteria. Infect Agents Dis. 1993;2:255–258. - PubMed

Publication types

MeSH terms

LinkOut - more resources