. 2010 Aug 6;285(32):24609-19.
doi: 10.1074/jbc.M110.121822. Epub 2010 Jun 7.

Mitochondria-targeted cytochrome P450 2E1 induces oxidative damage and augments alcohol-mediated oxidative stress

Affiliations

Mitochondria-targeted cytochrome P450 2E1 induces oxidative damage and augments alcohol-mediated oxidative stress

Seema Bansal et al. J Biol Chem. .

Abstract

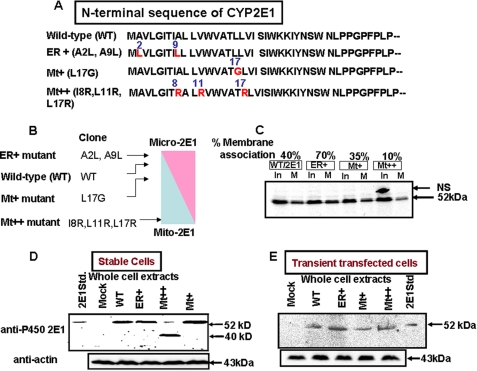
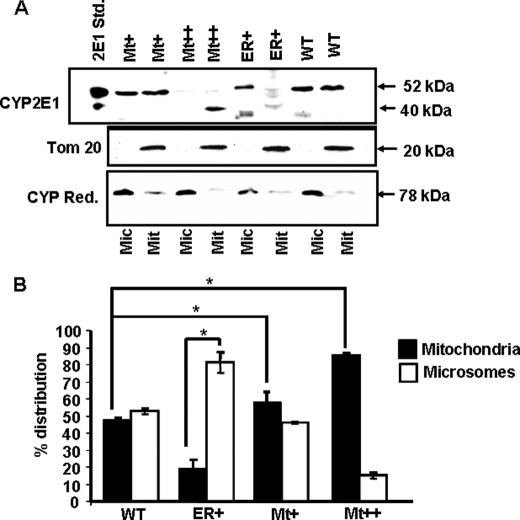
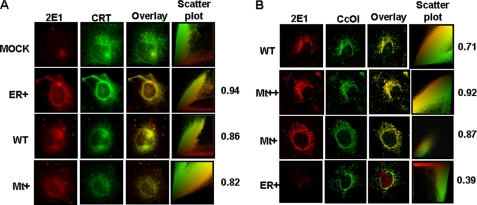
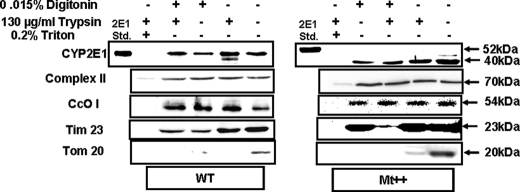
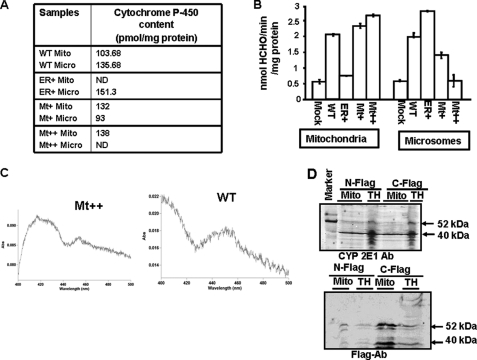
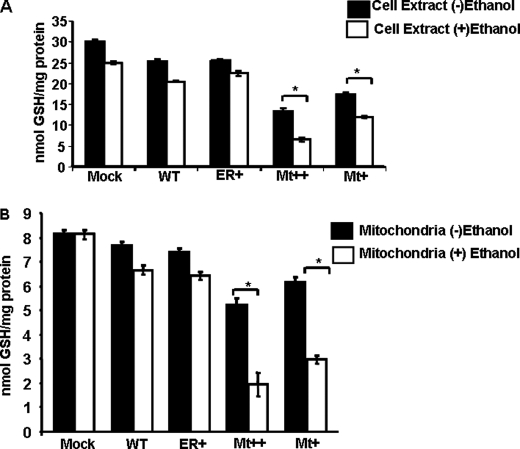
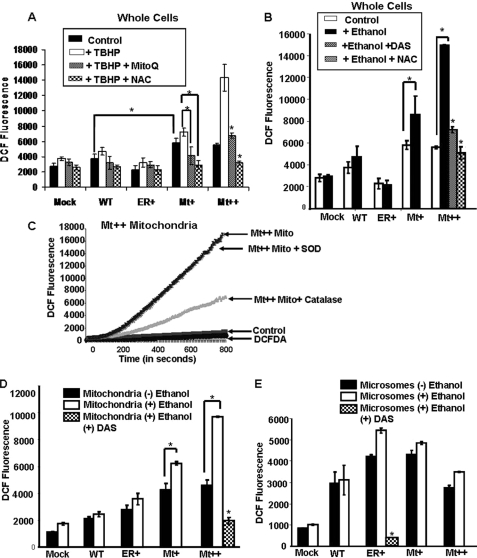
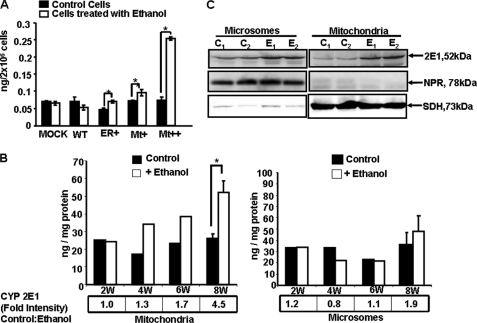
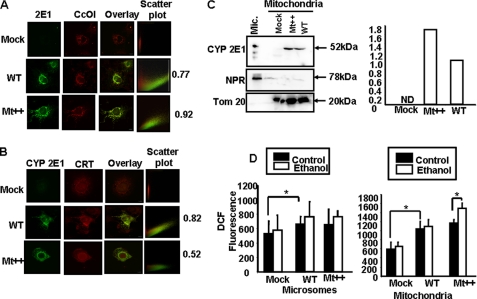
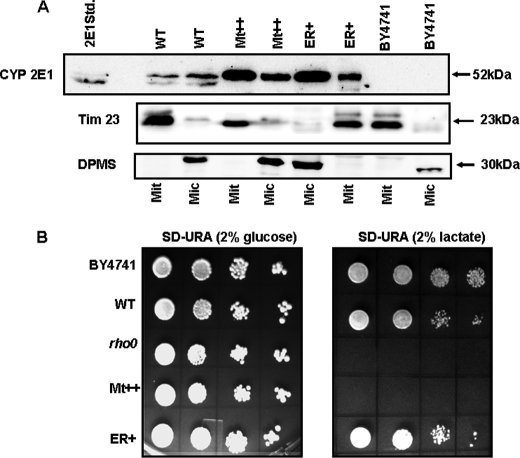
The ethanol-inducible cytochrome P450 2E1 (CYP2E1) is also induced under different pathological and physiological conditions. Studies including ours have shown that CYP2E1 is bimodally targeted to both the endoplasmic reticulum (microsomes) (mc CYP2E1) and mitochondria (mt CYP2E1). In this study we investigated the role of mtCYP2E1 in ethanol-mediated oxidative stress in stable cell lines expressing predominantly mt CYP2E1 or mc CYP2E1. The ER+ mutation (A2L, A9L), which increases the affinity of the nascent protein for binding to the signal recognition particle, preferentially targets CYP2E1 to the endoplasmic reticulum. The Mt+ (L17G) and Mt++ (I8R, L11R, L17R) mutant proteins, showing progressively lower affinity for signal recognition particle binding, were targeted to mitochondria at correspondingly higher levels. The rate of GSH depletion, used as a measure of oxidative stress, was higher in cells expressing Mt++ and Mt+ proteins as compared with cells expressing ER+ protein. In addition, the cellular level of F(2)-isoprostanes, a direct indicator of oxidative stress, was increased markedly in Mt++ cells after ethanol treatment. Notably, expression of Mt++ CYP2E1 protein in yeast cells caused more severe mitochondrial DNA damage and respiratory deficiency than the wild type or ER+ proteins as tested by the inability of cells to grow on glycerol or ethanol. Additionally, liver mitochondria from ethanol-fed rats containing high mt CYP2E1 showed higher levels of F(2)-isoprostane production. These results strongly suggest that mt CYP2E1 induces oxidative stress and augments alcohol-mediated cell/tissue injury.


Figures

FIGURE 1.
FIGURE 1.
A mutational approach for altering the bimodal targeting efficiency of CYP2E1. A, the WOLFPSORT program was utilized to alter the SRP binding and mitochondria-targeting efficiencies of the N-terminal signal regions of CYP2E1. B, shown is the predicted targeting efficiencies of WT and mutant CYP2E1 proteins. C, ER membrane binding efficiencies of WT, ER+, Mt+, and Mt++ proteins is shown. Proteins were co-translated with added ER membranes as described under “Experimental Procedures.” Membranes from half of the reaction mixture were sedimented through sucrose, and the pellets were dissolved in 2× Laemmli sample buffer (29) and loaded on the gel (M). The other half of the reaction mix was loaded directly as input (In). The gels were fluorographed and also imaged through a GE Healthcare STORM system for quantification of radioactivity in bands. NS means non-specific band. The numbers at the top of the blot show the percentages of 35S protein bound to ER in relation to the input. D, shown is an immunoblot of whole cell extracts (50 μg protein each) of COS cell lines stably expressing the WT and mutant CYP2E1 proteins and also a cell line expressing the empty (mock) retroviral vector. The level of β-actin was used as a loading control. Stable cell lines were generated by transducing COS-7 cells with CYP2E1 cDNA-containing retroviral plasmid (pBABE-puro) using FuGENE transfection (Roche Applied Sciences) reagent. E, immunoblot of COS cell extracts transiently transfected with WT and mutant CYP2E1 constructs. COS-7 cells were transfected with cDNAs cloned in PCMV4 expression vector as described under “Experimental Procedures.” β-Actin levels were used as loading controls. In Parts C, D, and E, proteins were resolved by electrophoresis through 12% SDS-polyacrylamide gels. In C, 25 μg of protein each from flotation gradients was used; in D and E, 50 μg of protein of each whole cell extract were used.
FIGURE 2.
FIGURE 2.
Subcellular distribution of CYP2E1 protein in stable cells. A, shown is an immunoblot analysis of microsomal and mitochondrial proteins from Mock and ER+-, WT-, Mt+-, and Mt++-expressing stable cell lines. Proteins (50 μg each) were resolved by SDS-PAGE on a 12% gel and subjected to immunoblot analysis with anti-CYP2E1 antibody (CYP Ref., 1:1500 dilution). The blots were also probed with an antibody to the mitochondria-specific marker TOM 20 and microsome-specific marker NPR. B, the gel was imaged through a Bio-Rad Florus imager, and the band densities were quantified using the Volume analysis software. Means ± S.D. were calculated based on three separate experiments. Asterisks represent significant difference (p < 0.05) in CYP2E1 contents between WT, Mt+, and Mt++ cells.
FIGURE 3.
FIGURE 3.
Immunocytochemical analysis of stable cell lines. Immunofluorescence microscopy was carried out in 0.1% Triton X-100-permeabilized stable cells incubated with primary CYP2E1 (anti-goat) antibody. The slides were co-stained either with CcO I (anti-mouse) antibody as the mitochondria-specific marker or CRT (anti-rabbit) antibody as the microsomal marker. The cells were subsequently incubated with Alexa 488-conjugated anti-rabbit antibody and Alexa 594-conjugated anti-mouse goat IgG for colocalization of fluorescence signals. Slides were examined by confocal microscopy through Leica TCS SP5 microscope.
FIGURE 4.
FIGURE 4.
Intramitochondrial localization of CYP2E1 in stable expression cells. Mitochondria from WT (left hand panel) and Mt++ cells (right panel) were treated with digitonin and or trypsin as described under “Experimental Procedures.” In the indicated experiments, mitochondria were treated with 0.2% Triton X-100 (v/v) before treatment with digitonin or trypsin. Proteins (50 μg each) were resolved on 12% SDS-PAGE and subjected to immunoblot analysis with CYP2E1 antibody. The blots were co-developed with antibodies to the 70-kDa subunit of complex II and Tim23. Blots from identically run companion blots were used for developing with antibodies to CcO I subunit and TOM20.
FIGURE 5.
FIGURE 5.
Metabolic activities of mitochondria and microsomes from WT and mutant CYP2E1-expressing stable cells. A, the heme contents of mitochondrial and microsomal isolates were determined by using the dithionite reduced and CO-bound difference spectra by the method of Omura and Sato (56). ND, not detected. B, microsomes and mitoplasts from stable cells were assayed for N-demethylation activities using dimethylnitrosamine as the substrate. Assays with mitochondria were carried out with added mitochondria-specific electron transport proteins, Adx and Adr (0.2 nmol of Adx and 0.02 nmol of Adr, respectively). Microsomal activities were driven by microsomal NPR as electron donor system. HCHO is formaldehyde. Values represent the mean ± S.D. of three separate assays. C, representative CO difference spectra for the WT and MT++ cell mitochondria are shown. D, immunoblot analysis of total cell extract (TH) or mitochondrial proteins (Mito) from Mt++ cells transfected with either C-terminal FLAG-tagged (C-FLAG) or N-terminal FLAG-tagged (N-Flag) Mt++ CYP2E1 cDNA is shown. The blot in the top panel was developed with CYP2E1 antibody, and the blot in the bottom panel was developed with FLAG antibody (1:1000 dilutions in each case). Ab, antibody.
FIGURE 6.
FIGURE 6.
Cellular and mitochondrial GSH levels in stable cells expressing WT and mutant CYP2E1. A, shown are GSH levels in stable expression cell lines. GSH levels were assayed using fluorometric substrate 5,5′-dithiobis-(2-nitrobenzoic acid). Briefly, cells (2 × 10⁶) were treated with or without 100 mm ethanol. After 48 h of treatment, the total cellular extracts (200 μg of protein), 200 μl of phosphate buffer provided in the kit, and 25 μl of the 5,5′-dithiobis-(2-nitrobenzoic acid) solution were first incubated at 37 °C for 5 min, and the absorbance (412 nm) was measured using a Cary E1 spectrophotometer for 3 min. GSH levels were calculated using a standard curve, and values are presented in nmol/mg protein/min. B, mitochondrial isolates from control and ethanol-treated cells were assayed for GSH levels as described above. Asterisks represent significant difference in GSH (p < 0.05) levels between ethanol-treated and untreated controls. Values represent the mean ± S.D. from six assays of the same cell fractions.
FIGURE 7.
FIGURE 7.
ROS measurements by DCFH-DA method in whole cells and subcellular fractions from CYP2E1 expressing cells. A, shown are ROS levels in whole cells grown with or without the added oxidant TBHP (400 μm) and/or antioxidants MitoQ (2.5 μm) and NAC (25 mm). B, shown are ROS levels in whole cells grown with or without added ethanol (100 mm) with or without the added CYP2E1 inhibitor DAS (10 μm) or NAC (25 mm). Details are as described under “Experimental Procedures.” C represents a control experiment using Mt++ mitochondria ruptured by freezing and thawing. Catalase (10 units/ml) and superoxide dismutase (SOD, 30 units/ml) were added. The assays were run as described under “Experimental Procedures” using 10 μl of brain cytosolic preparation per 100 μl of reaction volumes. D and E, ROS measurements in isolated mitochondria and microsomes, respectively, from the indicated cells are shown. DAS was added in indicated tubes at 10 μm levels. In all cases, the fluorescence was recorded at an excitation at 488 nm and emissions at 525 nm for 15 min. Values represent the mean ± S.D. values from four separate assays in A, B, D, and E. Asterisks represent significant increase in ROS production (p < 0.05) or reduction by added antioxidants or CYP2E1 inhibitor, DAS.
FIGURE 8.
FIGURE 8.
Ethanol-induced F2-isoprostanes in CYP2E1-expressing cells and liver fractions from ethanol-fed rats. A, F2-isoprostanes were assayed by using a gas chromatograph-mass spectroscopy method cited under “Experimental Procedures.” In each case 2 × 10⁶ total cells were used for the assay. Asterisks represent significant increase in F2-isoprostanes in ER+, Mt+, and Mt++ cells after ethanol treatment (p < 0.05). Values represent the mean ± S.D. of three assays. B, F2-isopreostanes were measured in mitochondria and microsomes isolated from the livers of rats fed with alcohol for 2–8 weeks (W) and pair-fed controls. In each case 100 μg of protein was used. The means ± S.D. in the 8-week-fed rats were based on assays carried out in three rats each in control and fed groups. Asterisks represent significant difference (p < 0.05) from pair-fed controls. The values presented in boxes below the graph indicate the ratios of CYP2E1 contents between pair-fed controls and alcohol-fed rat livers. The CYP2E1 antibody interactive bands from immunoblots were quantified by imaging through the Bio-Rad Florus 5 gel documentation system. C, shown is an immunoblot analysis of mitochondrial and microsomal proteins (25 μg each) from livers of rats fed with alcohol for 8 weeks and pair-fed controls. Samples from two rats were analyzed in each case. Duplicate blots were developed with NPR antibody and succinate dehydrogenase (SDH) antibody for assessing cross-contamination and loading levels.
FIGURE 9.
FIGURE 9.
Mitochondrial targeting of intact CYP2E1 in transiently transfected COS cells. A and B, shown is immunocytochemical analysis of transfected cells using mitochondria-specific CcO I and CYP2E1 antibodies (A) and microsome-specific CRT and CYP2E1 antibodies (B). Immunocytochemical analysis and colocalization of stained membrane structures were carried out as described under “Experimental Procedures” and in Fig. 3. C, shown is immunoblot analysis of mitochondrial proteins (50 μg each) from cells transfected with mock vector, WT, and Mt++ cDNAs. Microsome from ethanol-treated rat liver was used as a positive control for CYP2E1 and also NPR. The blots were co-developed with antibodies to mitochondrial marker, TOM20, and microsomal marker NPR. The graph next to the blot represents CYP2E1 contents. ND, not detected. D, shown is the level of ROS production in the microsome and mitochondria isolated from transfected cells. The ROS production was measured fluorometrically by DCFH-DA oxidation method as described in Fig. 7 and under “Experimental Procedures.” The means ± S.D. values were calculated from six assays carried out with cell fractions from two separate transfections. Asterisks represent significant difference (p < 0.05) between the paired values.
FIGURE 10.
FIGURE 10.
Mitochondrial CYP2E1-induced respiratory deficiency in yeast cells. A, shown are mitochondrial and microsomal CYP2E1 contents in yeast cells stably expressing WT and mutant CYP2E1 cDNA constructs. The mitochondrial and microsomal proteins (50 μg each) were resolved by SDS-PAGE on a 12% gel and subjected to immunoblot blot analysis with anti-CYP2E1 antibody. Two identically run (parallel) blots were probed with antibody to mitochondria-specific marker Tim 23 and microsome-specific marker dolicholphosphate mannose synthase (DPMS). B, yeast cells expressing ER+, WT, and Mt++ CYP2E1 were grown in yeast extract/peptone/dextrose medium supplemented with appropriate amino acids. Cells corresponding to 2.0 absorbance units at 600 nm were pelleted and resuspended in 1 ml of sterile water. The culture was serially diluted 10 times, and 10 μl of each dilution was spotted onto SD−URA plates containing 2% glucose (w/v) (left panel) and 2% lactate (w/v) (right panel). Plates were incubated at 30 °C for 4 days and photographed.

Similar articles

Cited by

References

    1. Bondoc F. Y., Bao Z., Hu W. Y., Gonzalez F. J., Wang Y., Yang C. S., Hong J. Y. (1999) Biochem. Pharmacol. 58, 461–463 - PubMed
    1. Ronis M. J., Lindros K. O., Ingelman-Sundberg M. (1996) in Cytochromes P450, Pharmacological and Toxicological Aspects (Ioannides C. ed.) CRC Press. Inc., Boca Raton, FL
    1. Sohn O. S., Fiala E. S., Requeijo S. P., Weisburger J. H., Gonzalez F. J. (2001) Cancer Res. 61, 8435–8440 - PubMed
    1. Sumner S. C., Fennell T. R., Moore T. A., Chanas B., Gonzalez F., Ghanayem B. I. (1999) Chem. Res. Toxicol. 12, 1110–1116 - PubMed
    1. Zaher H., Buters J. T., Ward J. M., Bruno M. K., Lucas A. M., Stern S. T., Cohen S. D., Gonzalez F. J. (1998) Toxicol. Appl. Pharmacol. 152, 193–199 - PubMed

Publication types

LinkOut - more resources