

Subdomain 3 of Plasmodium falciparum VAR2CSA DBL3x is identified as a minimal chondroitin sulfate A-binding region
- PMID: 20529864
- PMCID: PMC2915721
- DOI: 10.1074/jbc.M110.118612
Subdomain 3 of Plasmodium falciparum VAR2CSA DBL3x is identified as a minimal chondroitin sulfate A-binding region
Abstract
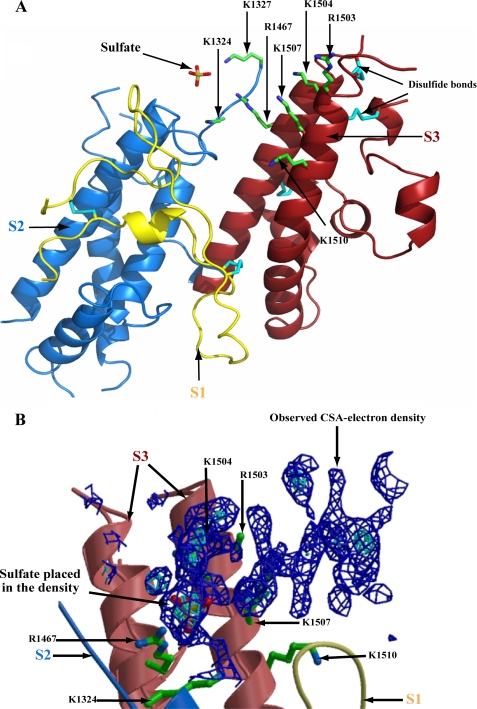
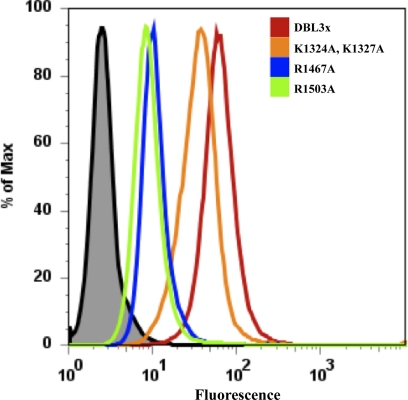
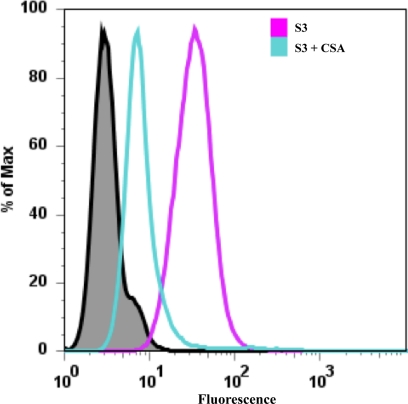
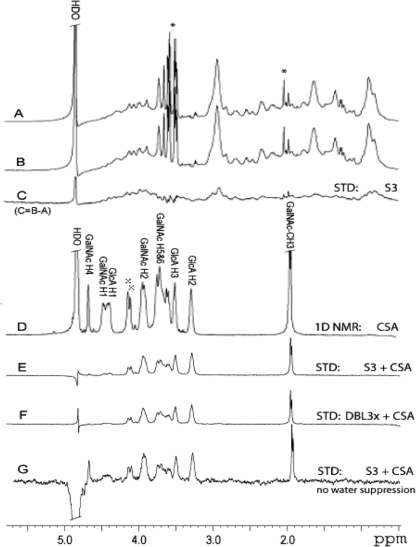
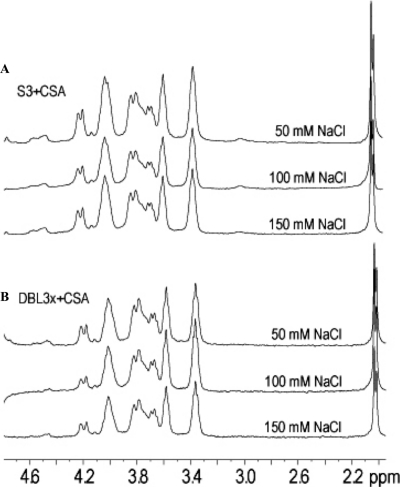
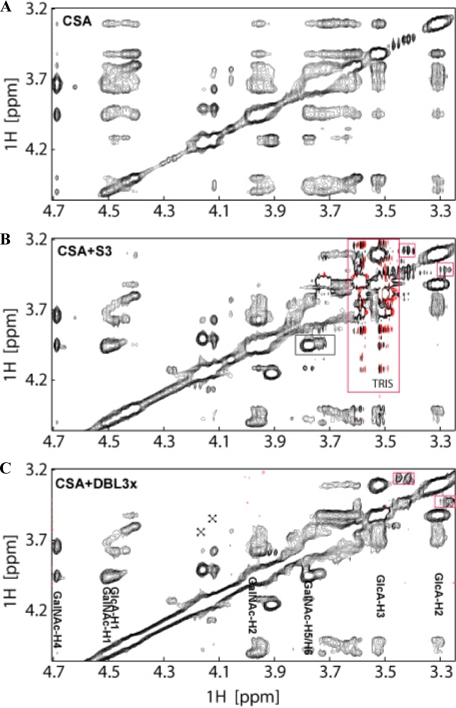
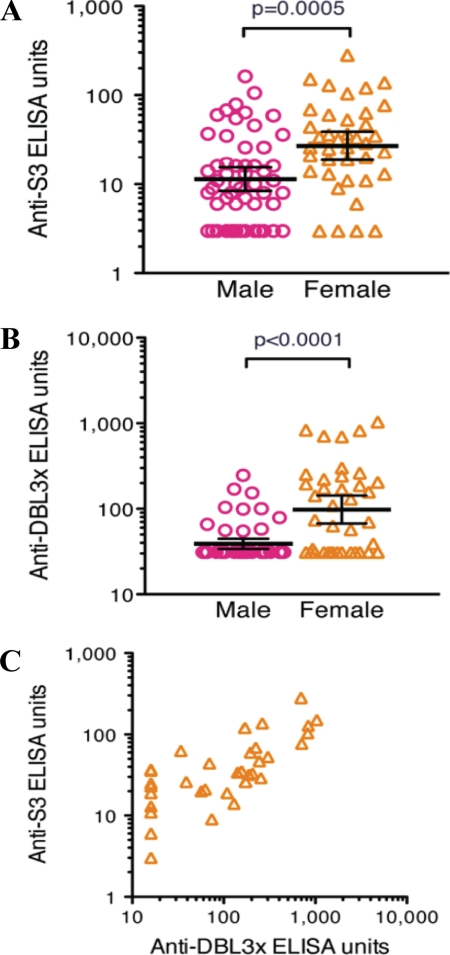
Molecular interactions between the VAR2CSA protein, expressed on the surface of Plasmodium falciparum-infected erythrocytes, and placental chondroitin sulfate A (CSA) are primarily responsible for pregnancy-associated malaria (PAM). Interrupting these interactions may prevent or ameliorate the severity of PAM. Several of the Duffy binding-like (DBL) domains of VAR2CSA, including the DBL3x domain, have been shown to bind CSA in vitro, but a more detailed understanding of how DBL domains bind CSA is needed. In this study, we demonstrate that subdomain 3 (S3), one of the three subdomains of VAR2CSA DBL3x by itself, is the major contributor toward CSA binding. NMR spectroscopy and flow cytometry analyses show that S3 and the intact DBL3x domain bind CSA similarly. Mutations within the S3 portion of DBL3x markedly affect CSA binding. Both recombinant molecules, S3 and DBL3x, are recognized by antibodies in the plasma of previously pregnant women living in malaria-endemic regions of Mali, but much less so by plasma from men of the same regions. As the S3 sequence is highly conserved in all known VAR2CSA proteins expressed by different parasite isolates obtained from various malaria endemic areas of the world, the identification of S3 as an independent CSA-binding region provides a compelling molecular basis for designing interventions against PAM.
Figures
Similar articles
-
Identification of VAR2CSA domain-specific inhibitory antibodies of the Plasmodium falciparum erythrocyte membrane protein 1 using a novel flow cytometry assay.Clin Vaccine Immunol. 2013 Mar;20(3):433-42. doi: 10.1128/CVI.00638-12. Epub 2013 Jan 23. Clin Vaccine Immunol. 2013. PMID: 23345587 Free PMC article.
-
VAR2CSA signatures of high Plasmodium falciparum parasitemia in the placenta.PLoS One. 2013 Jul 25;8(7):e69753. doi: 10.1371/journal.pone.0069753. Print 2013. PLoS One. 2013. PMID: 23936092 Free PMC article.
-
Structure of the DBL3x domain of pregnancy-associated malaria protein VAR2CSA complexed with chondroitin sulfate A.Nat Struct Mol Biol. 2008 Sep;15(9):932-8. doi: 10.1038/nsmb.1479. Nat Struct Mol Biol. 2008. PMID: 19172746 Free PMC article.
-
Structural insights into chondroitin sulfate binding in pregnancy-associated malaria.Biochem Soc Trans. 2010 Oct;38(5):1337-41. doi: 10.1042/BST0381337. Biochem Soc Trans. 2010. PMID: 20863310 Review.
-
Can any lessons be learned from the ambiguous glycan binding of PfEMP1 domains?Trends Parasitol. 2010 May;26(5):230-5. doi: 10.1016/j.pt.2010.02.002. Epub 2010 Feb 26. Trends Parasitol. 2010. PMID: 20189879 Review.
Cited by
-
Identification of VAR2CSA domain-specific inhibitory antibodies of the Plasmodium falciparum erythrocyte membrane protein 1 using a novel flow cytometry assay.Clin Vaccine Immunol. 2013 Mar;20(3):433-42. doi: 10.1128/CVI.00638-12. Epub 2013 Jan 23. Clin Vaccine Immunol. 2013. PMID: 23345587 Free PMC article.
-
The chondroitin sulfate A-binding site of the VAR2CSA protein involves multiple N-terminal domains.J Biol Chem. 2011 May 6;286(18):15908-17. doi: 10.1074/jbc.M110.191510. Epub 2011 Mar 11. J Biol Chem. 2011. PMID: 21398524 Free PMC article.
-
Functional comparison of Plasmodium falciparum transmission-blocking vaccine candidates by the standard membrane-feeding assay.Infect Immun. 2013 Dec;81(12):4377-82. doi: 10.1128/IAI.01056-13. Epub 2013 Sep 16. Infect Immun. 2013. PMID: 24042109 Free PMC article.
-
Progress and Insights Toward an Effective Placental Malaria Vaccine.Front Immunol. 2021 Feb 25;12:634508. doi: 10.3389/fimmu.2021.634508. eCollection 2021. Front Immunol. 2021. PMID: 33717176 Free PMC article. Review.
-
A conserved epitope in VAR2CSA is targeted by a cross-reactive antibody originating from Plasmodium vivax Duffy binding protein.Front Cell Infect Microbiol. 2023 Jun 16;13:1202276. doi: 10.3389/fcimb.2023.1202276. eCollection 2023. Front Cell Infect Microbiol. 2023. PMID: 37396303 Free PMC article.
References
-
- Brabin B. J., Romagosa C., Abdelgalil S., Menéndez C., Verhoeff F. H., McGready R., Fletcher K. A., Owens S., D'Alessandro U., Nosten F., Fischer P. R., Ordi J. (2004) Placenta 25, 359–378 - PubMed
-
- Salanti A., Staalsoe T., Lavstsen T., Jensen A. T., Sowa M. P., Arnot D. E., Hviid L., Theander T. G. (2003) Mol. Microbiol. 49, 179–191 - PubMed
-
- Trimnell A. R., Kraemer S. M., Mukherjee S., Phippard D. J., Janes J. H., Flamoe E., Su X. Z., Awadalla P., Smith J. D. (2006) Mol. Biochem. Parasitol. 148, 169–180 - PubMed
-
- Rowe J. A., Kyes S. A., Rogerson S. J., Babiker H. A., Raza A. (2002) J. Infect. Dis. 185, 1207–1211 - PubMed
-
- Fried M., Hixson K. K., Anderson L., Ogata Y., Mutabingwa T. K., Duffy P. E. (2007) Mol. Biochem. Parasitol. 155, 57–65 - PubMed
Publication types
MeSH terms
Substances
Grants and funding
LinkOut - more resources
Full Text Sources
Other Literature Sources
Research Materials
Miscellaneous
