. 2010 Jun 15;26(12):i106-14.
doi: 10.1093/bioinformatics/btq213.

Robust unmixing of tumor states in array comparative genomic hybridization data

Affiliations

Robust unmixing of tumor states in array comparative genomic hybridization data

David Tolliver et al. Bioinformatics. .

Abstract

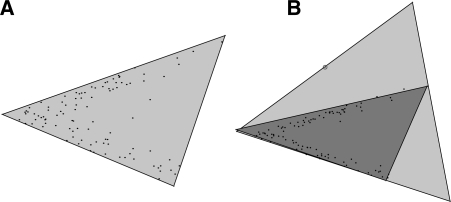
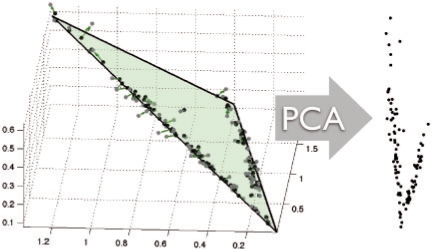
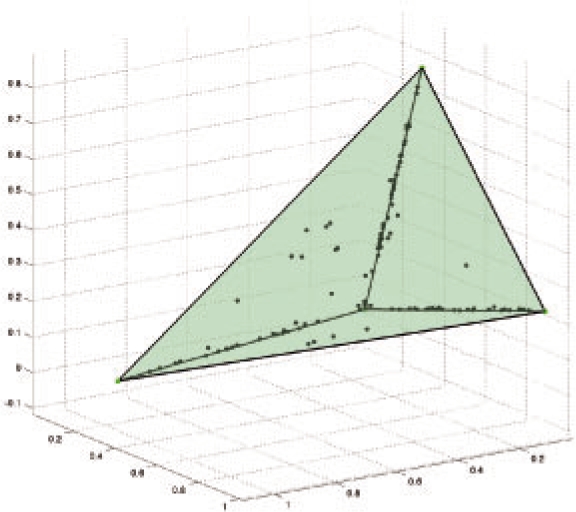
Motivation: Tumorigenesis is an evolutionary process by which tumor cells acquire sequences of mutations leading to increased growth, invasiveness and eventually metastasis. It is hoped that by identifying the common patterns of mutations underlying major cancer sub-types, we can better understand the molecular basis of tumor development and identify new diagnostics and therapeutic targets. This goal has motivated several attempts to apply evolutionary tree reconstruction methods to assays of tumor state. Inference of tumor evolution is in principle aided by the fact that tumors are heterogeneous, retaining remnant populations of different stages along their development along with contaminating healthy cell populations. In practice, though, this heterogeneity complicates interpretation of tumor data because distinct cell types are conflated by common methods for assaying the tumor state. We previously proposed a method to computationally infer cell populations from measures of tumor-wide gene expression through a geometric interpretation of mixture type separation, but this approach deals poorly with noisy and outlier data.

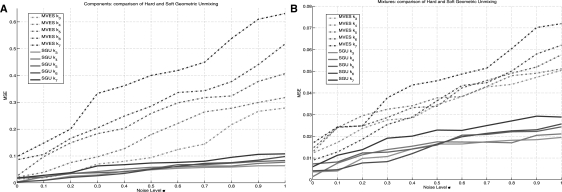
Results: In the present work, we propose a new method to perform tumor mixture separation efficiently and robustly to an experimental error. The method builds on the prior geometric approach but uses a novel objective function allowing for robust fits that greatly reduces the sensitivity to noise and outliers. We further develop an efficient gradient optimization method to optimize this 'soft geometric unmixing' objective for measurements of tumor DNA copy numbers assessed by array comparative genomic hybridization (aCGH) data. We show, on a combination of semi-synthetic and real data, that the method yields fast and accurate separation of tumor states.

Conclusions: We have shown a novel objective function and optimization method for the robust separation of tumor sub-types from aCGH data and have shown that the method provides fast, accurate reconstruction of tumor states from mixed samples. Better solutions to this problem can be expected to improve our ability to accurately identify genetic abnormalities in primary tumor samples and to infer patterns of tumor evolution.

Supplementary information: Supplementary data are available at Bioinformatics online.


Figures

Fig. 1.
Fig. 1.
(A) The minimum area fit of a simplex containing the sample points in the plane (shown in black) using the program in Section 2.1.1. On noiseless data, hard geometric unmixing recovers the locations of the fundamental components at the vertices. (B) However, the containment simplex is highly sensitive to noise and outliers in the data. A single outlier, circled above, radically changes the shape of the containment simplex fit (light gray above). In turn, this changes the estimates of basis distributions used to unmix the data. We mitigate this short coming by developing a soft geometric unmixing model (see Section 2.1.2) that is comparatively robust to noise. The soft fit (shown dark gray) is geometrically very close to the generating sources as seen on the left.
Fig. 2.
Fig. 2.
An illustration of the reduced coordinates under the unmixing hypothesis: points (show in gray) sampled from the 3—simplex embedded are ℜ3 and then perturbed by log-normal noise, producing points shown in black with sample correspondence given the green arrows. Note that the dominant subspace remains in the planar variation induced by the simplex, and a 2D reduced representation for simplex fitting is thus sufficient.
Fig. 3.
Fig. 3.
An example sample set generated for Section 3.1.2 shown in the ‘intrinsic dimensions’ of the model. Note that sample points cleave to the lower dimensional substructure (edges) of the simplex.
Fig. 4.
Fig. 4.
(A): mean squared error for the component reconstruction comparing hard geometric unmixing (MVES: Chan et al., 2009) and soft geometric unmixing (SGU) introduced in Section 2.1.2 for the experiment described in Section 3.1.2 with variable γ. The plot demonstrates that robust unmixing more accurately reconstructs the ground truth centers relative to hard unmixing in the presence of noise. (B): mean squared error for mixture reconstruction comparing MVES and SGU.
Fig. 5.
Fig. 5.
Empirical motivation for the ℓ1 − ℓ1−total variation functional for smoothing CGH data. (A) The plot shows the histogram of values found in the CGH data obtained from the Navin et al. (2010) dataset. The distribution is well fit by the high kurtosis Laplacian distribution in lieu of a Gaussian. (B)The plot shows the distribution of differences along the probe array values. As with the values distribution, these frequencies exhibit high kurtosis.
Fig. 6.
Fig. 6.
The simplex fit to the CGH data samples from Navin et al. (2010) ductal dataset in ℜ3. The gray tetrahedron was return by the optimization of Program 1 and the green tetrahedron was returned by the robust unmixing routine.
Fig. 7.
Fig. 7.
Inferred mixture fractions for six-component soft geometric unmixing applied to breast cancer aCGH data. Data is grouped by tumor, with multiple sectors per tumor placed side-by-side. Columns are annotated below by sector or N for normal control and above by cell sorting fraction (D for diploid, H for hypodiploid, A for aneuploid and A1/A2 for subsets of aneuploid) where cell sorting was used.
Fig. 8.
Fig. 8.
Copy numbers of inferred components versus genomic position. The average of all input arrays (top) is shown for comparison, with the six components below. Benchmarks loci are indicated by yellow vertical bars.
Fig. 9.
Fig. 9.
Plot of amplification per probe highlighting regions of shared amplification across components. The lower (blue) dots mark the location of the collected cancer benchmarks set. Bars highlight specific markers of high shared amplification for discussion in the text. Above: A: 1q21 (site of MUC1), B: 9p21 (site of CDKN2B), C: 7q21 (site of HER2), D: 17q12 (site of PGAP3), E: 5q21 (site of APC/MCC).

Similar articles

Cited by

References

    1. Atkins JH, Gershell LJ. From the analyst's couch: selective anticancer drugs. Nat. Rev. Cancer. 2002;2:645–646. - PubMed
    1. Beerenwinkel N, et al. Mtreemix: a software package for learning and using mixture models of mutagenetic trees. Bioinformatics. 2005;21:2106–2107. - PubMed
    1. Bild AH, et al. Opinion: linking oncogenic pathways with therapeutic opportunities. Nat. Rev. Cancer. 2006;6:735–741. - PubMed
    1. Boyd S, Vandenberghe L. Convex Optimization. New York, NY: Cambridge University Press; 2004.
    1. Chan T, et al. A convex analysis based minimum-volume enclosing simplex algorithm for hyperspectral unmixing. IEEE Trans. Signal Proc. 2009;57:4418–4432.

Publication types

MeSH terms