

Efficient identification of identical-by-descent status in pedigrees with many untyped individuals
- PMID: 20529905
- PMCID: PMC2881406
- DOI: 10.1093/bioinformatics/btq222
Efficient identification of identical-by-descent status in pedigrees with many untyped individuals
Abstract
Motivation: Inference of identical-by-descent (IBD) probabilities is the key in family-based linkage analysis. Using high-density single nucleotide polymorphism (SNP) markers, one can almost always infer haplotype configurations of each member in a family given all individuals being typed. Consequently, the IBD status can be obtained directly from haplotype configurations. However, in reality, many family members are not typed due to practical reasons. The problem of IBD/haplotype inference is much harder when treating untyped individuals as missing.
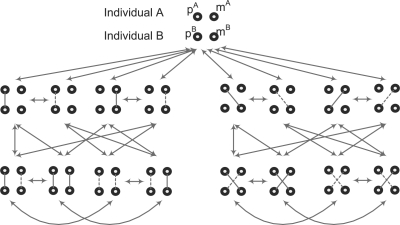
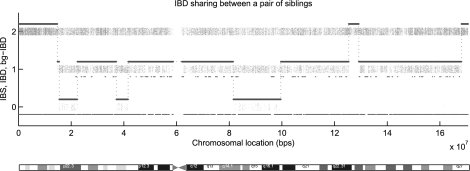
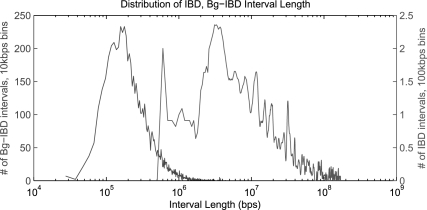
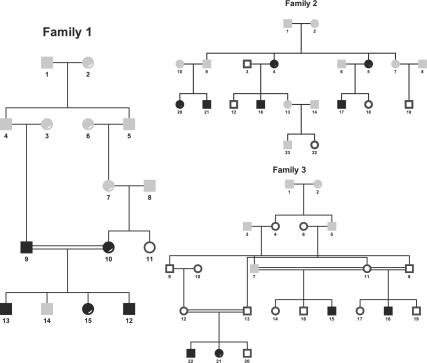
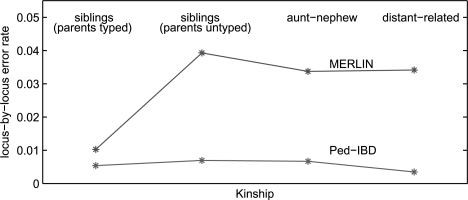
Results: We present a novel hidden Markov model (HMM) approach to infer the IBD status in a pedigree with many untyped members using high-density SNP markers. We introduce the concept of inheritance-generating function, defined for any pair of alleles in a descent graph based on a pedigree structure. We derive a recursive formula for efficient calculation of the inheritance-generating function. By aggregating all possible inheritance patterns via an explicit representation of the number and lengths of all possible paths between two alleles, the inheritance-generating function provides a convenient way to theoretically derive the transition probabilities of the HMM. We further extend the basic HMM to incorporate population linkage disequilibrium (LD). Pedigree-wise IBD sharing can be constructed based on pair-wise IBD relationships. Compared with traditional approaches for linkage analysis, our new model can efficiently infer IBD status without enumerating all possible genotypes and transmission patterns of untyped members in a family. Our approach can be reliably applied on large pedigrees with many untyped members, and the inferred IBD status can be used for non-parametric genome-wide linkage analysis.
Availability: The algorithm is implemented in Matlab and is freely available upon request.
Supplementary information: Supplementary data are available on Bioinformatics online.
Figures
Similar articles
-
Haplotype reconstruction in large pedigrees with untyped individuals through IBD inference.J Comput Biol. 2011 Nov;18(11):1411-21. doi: 10.1089/cmb.2011.0167. Epub 2011 Sep 16. J Comput Biol. 2011. PMID: 21923410 Free PMC article.
-
Inferring coancestry in population samples in the presence of linkage disequilibrium.Genetics. 2012 Apr;190(4):1447-60. doi: 10.1534/genetics.111.137570. Epub 2012 Jan 31. Genetics. 2012. PMID: 22298700 Free PMC article.
-
Multipoint approximations of identity-by-descent probabilities for accurate linkage analysis of distantly related individuals.Am J Hum Genet. 2008 Mar;82(3):607-22. doi: 10.1016/j.ajhg.2007.12.016. Am J Hum Genet. 2008. PMID: 18319071 Free PMC article.
-
Combinatorial Conflicting Homozygosity (CCH) analysis enables the rapid identification of shared genomic regions in the presence of multiple phenocopies.BMC Genomics. 2015 Mar 10;16(1):163. doi: 10.1186/s12864-015-1360-4. BMC Genomics. 2015. PMID: 25888400 Free PMC article.
-
Identity by descent between distant relatives: detection and applications.Annu Rev Genet. 2012;46:617-33. doi: 10.1146/annurev-genet-110711-155534. Epub 2012 Sep 17. Annu Rev Genet. 2012. PMID: 22994355 Review.
Cited by
-
Privacy preserving protocol for detecting genetic relatives using rare variants.Bioinformatics. 2014 Jun 15;30(12):i204-11. doi: 10.1093/bioinformatics/btu294. Bioinformatics. 2014. PMID: 24931985 Free PMC article.
-
Identifying bipolar disorder susceptibility loci in a densely affected pedigree.Mol Psychiatry. 2013 Dec;18(12):1245-6. doi: 10.1038/mp.2012.176. Epub 2012 Dec 18. Mol Psychiatry. 2013. PMID: 23247078 Free PMC article. No abstract available.
-
scHaplotyper: haplotype construction and visualization for genetic diagnosis using single cell DNA sequencing data.BMC Bioinformatics. 2020 Feb 1;21(1):41. doi: 10.1186/s12859-020-3381-5. BMC Bioinformatics. 2020. PMID: 32007105 Free PMC article.
-
IPED: inheritance path-based pedigree reconstruction algorithm using genotype data.J Comput Biol. 2013 Oct;20(10):780-91. doi: 10.1089/cmb.2013.0080. J Comput Biol. 2013. PMID: 24093229 Free PMC article.
-
High-resolution transcriptome analysis with long-read RNA sequencing.PLoS One. 2014 Sep 24;9(9):e108095. doi: 10.1371/journal.pone.0108095. eCollection 2014. PLoS One. 2014. PMID: 25251678 Free PMC article.
References
-
- Abecasis GR, et al. Merlin–rapid analysis of dense genetic maps using sparse gene flow trees. Nat. Genet. 2002;30:97–101. - PubMed
-
- Elston RC, Stewart J. A general model for the genetic analysis of pedigree data. Hum. Hered. 1971;21:523–542. - PubMed
-
- Gudbjartsson DF, et al. Allegro version 2. Nat. Genet. 2005;37:1015–1016. - PubMed
Publication types
MeSH terms
Grants and funding
LinkOut - more resources
Full Text Sources
Other Literature Sources
Research Materials
