

Efficient genome ancestry inference in complex pedigrees with inbreeding
- PMID: 20529906
- PMCID: PMC2881372
- DOI: 10.1093/bioinformatics/btq187
Efficient genome ancestry inference in complex pedigrees with inbreeding
Abstract
Motivation: High-density SNP data of model animal resources provides opportunities for fine-resolution genetic variation studies. These genetic resources are generated through a variety of breeding schemes that involve multiple generations of matings derived from a set of founder animals. In this article, we investigate the problem of inferring the most probable ancestry of resulting genotypes, given a set of founder genotypes. Due to computational difficulty, existing methods either handle only small pedigree data or disregard the pedigree structure. However, large pedigrees of model animal resources often contain repetitive substructures that can be utilized in accelerating computation.
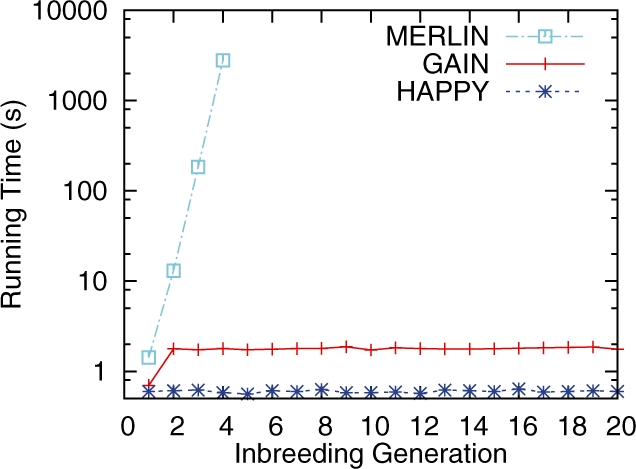
Results: We present an accurate and efficient method that can accept complex pedigrees with inbreeding in inferring genome ancestry. Inbreeding is a commonly used process in generating genetically diverse and reproducible animals. It is often carried out for many generations and can account for most of the computational complexity in real-world model animal pedigrees. Our method builds a hidden Markov model that derives the ancestry probabilities through inbreeding process without explicit modeling in every generation. The ancestry inference is accurate and fast, independent of the number of generations, for model animal resources such as the Collaborative Cross (CC). Experiments on both simulated and real CC data demonstrate that our method offers comparable accuracy to those methods that build an explicit model of the entire pedigree, but much better scalability with respect to the pedigree size.
Figures


References
-
- Abecasis GR, et al. MERLIN-rapid analysis of dense genetic maps using sparse gene flow trees. Nat. Genet. 2002;30:97–101. - PubMed
-
- Browning S, Browning BL. On Reducing the Statespace of Hidden Markov Models for the Identity by Descent Process. Theor. Popul. Biol. 2002;62:1–8. - PubMed
-
- Chia R, et al. The origins and uses of mouse outbred stocks. Nat. Genet. 2005;37:1181–1186. - PubMed
-
- Churchill GA, et al. The Collaborative Cross, a community resource for the genetic analysis of complex traits. Nat. Genet. 2002;36:1133–1137. - PubMed
-
- Donnelly KP. The probability that related individuals share some section of genome identical by descent. Theor. Popul. Biol. 1983;23:34–63. - PubMed
Publication types
MeSH terms
Grants and funding
LinkOut - more resources
Full Text Sources
Molecular Biology Databases
