. 2010 Jun 15;26(12):i237-45.
doi: 10.1093/bioinformatics/btq182.

Inference of patient-specific pathway activities from multi-dimensional cancer genomics data using PARADIGM

Affiliations

Inference of patient-specific pathway activities from multi-dimensional cancer genomics data using PARADIGM

Charles J Vaske et al. Bioinformatics. .

Abstract

Motivation: High-throughput data is providing a comprehensive view of the molecular changes in cancer tissues. New technologies allow for the simultaneous genome-wide assay of the state of genome copy number variation, gene expression, DNA methylation and epigenetics of tumor samples and cancer cell lines. Analyses of current data sets find that genetic alterations between patients can differ but often involve common pathways. It is therefore critical to identify relevant pathways involved in cancer progression and detect how they are altered in different patients.

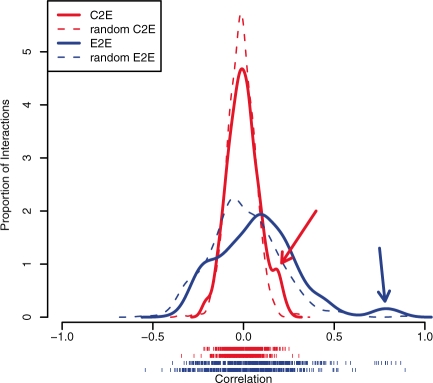
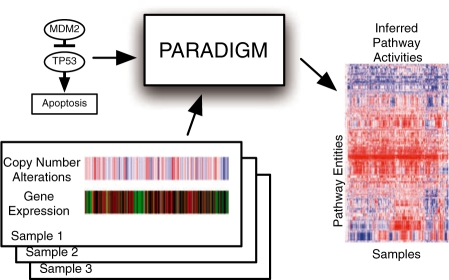
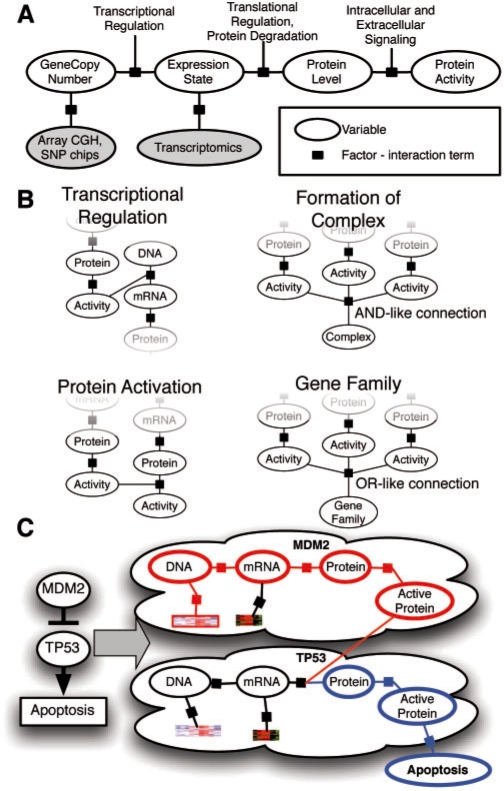
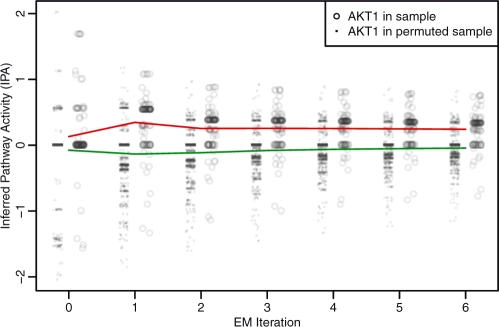
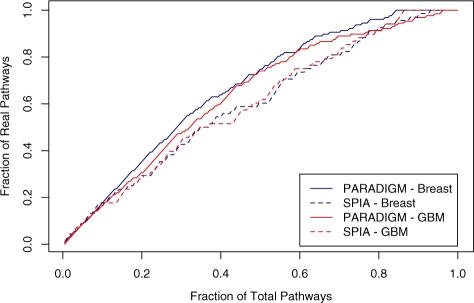
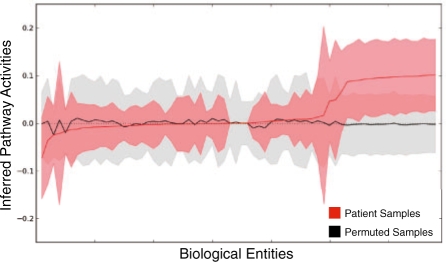
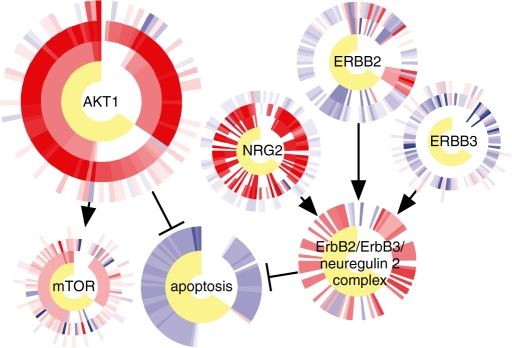
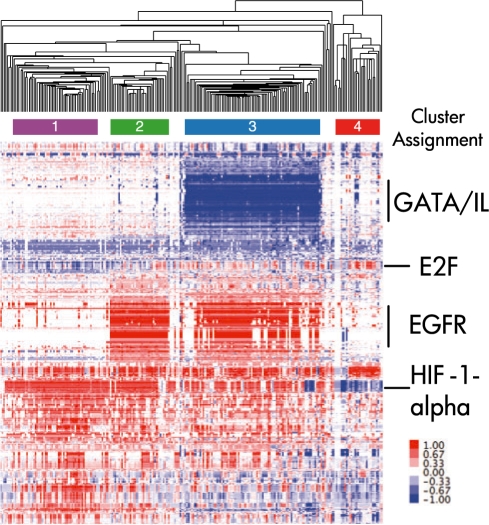
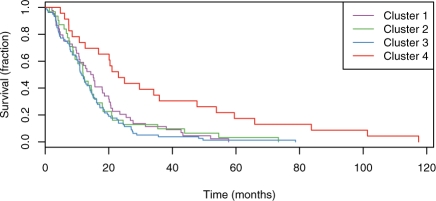
Results: We present a novel method for inferring patient-specific genetic activities incorporating curated pathway interactions among genes. A gene is modeled by a factor graph as a set of interconnected variables encoding the expression and known activity of a gene and its products, allowing the incorporation of many types of omic data as evidence. The method predicts the degree to which a pathway's activities (e.g. internal gene states, interactions or high-level 'outputs') are altered in the patient using probabilistic inference. Compared with a competing pathway activity inference approach called SPIA, our method identifies altered activities in cancer-related pathways with fewer false-positives in both a glioblastoma multiform (GBM) and a breast cancer dataset. PARADIGM identified consistent pathway-level activities for subsets of the GBM patients that are overlooked when genes are considered in isolation. Further, grouping GBM patients based on their significant pathway perturbations divides them into clinically-relevant subgroups having significantly different survival outcomes. These findings suggest that therapeutics might be chosen that target genes at critical points in the commonly perturbed pathway(s) of a group of patients.

Availability: Source code available at http://sbenz.github.com/Paradigm,.

Supplementary information: Supplementary data are available at Bioinformatics online.


Figures

Fig. 1.
Fig. 1.
NCI Pathway interactions in TCGA GBM data. For all (n=462) pairs where A was found to be an upstream activator of gene B in NCI-Nature Pathway Database, the Pearson correlation (x-axis) computed from the TCGA GBM data was calculated in two different ways. The histogram plots the correlations between the A's copy number and B's expression (C2E, solid red) and between A's expression and B's expression (E2E, blue). A histogram of correlations between randomly paired genes is shown for C2E (dashed red) and E2E (dashed blue). Arrows point to the enrichment of positive correlations found for the C2E (red) and E2E (blue) correlation.
Fig. 2.
Fig. 2.
Overview of the PARADIGM method. PARADIGM uses a pathway schematic with functional genomic data to infer genetic activities that can be used for further downstream analysis.
Fig. 3.
Fig. 3.
Conversion of a genetic pathway diagram into a PARADIGM model. A. Data on a single patient is integrated for a single gene using a set of four different biological entities for the gene describing the DNA copies, mRNA and protein levels, and activity of the protein. B. PARADIGM models various types of interactions across genes including transcription factors to targets (upper-left), subunits aggregating in a complex (upper-right), post-translational modification (lower-left) and sets of genes in a family performing redundant functions (lower-right). C. Toy example of a small sub-pathway involving P53, an inhibitor MDM2, and the high level process, apoptosis as represented in the model.
Fig. 4.
Fig. 4.
Learning parameters for AKT1. IPAs are shown at each iteration of the EM algorithm until convergence. Dots show IPAs from permuted samples and circles show IPAs from real samples. The red line denotes the mean IPA in real samples and the green line denotes the mean IPA of null samples.
Fig. 5.
Fig. 5.
Distinguishing decoy from real pathways with PARADIGM and SPIA. Decoy pathways were created by assigning a new gene name to each gene in a pathway. PARADIGM and SPIA were then used to compute the perturbation of every pathway. Each line shows the receiver-operator characteristic for distinguishing real from decoy pathways using the perturbation ranking. In breast cancer, the areas under the curve (AUCs) are 0.669 and 0.602 for PARADIGM and SPIA, respectively. In GBM, the AUCs are 0.642 and 0.604, respectively.
Fig. 6.
Fig. 6.
Patient sample IPAs compared with ‘within’ permutations for Class I PI3K signaling events mediated by Akt in breast cancer. Biological entities were sorted by mean IPA in the patient samples (red) and compared with the mean IPA for the permuted samples. The colored areas around each mean denote the of SD each set. IPA's on the right include AKT1, CHUK and MDM2.
Fig. 7.
Fig. 7.
CircleMap display of the ErbB2 pathway. For each node, ER status, IPAs, expression data and copy-number data are displayed as concentric circles, from innermost to outermost, respectively. The apoptosis node and the ErbB2/ErbB3/neuregulin 2 complex node have circles only for ER status and for IPAs, as there are no direct observations of these entities. Each patient's data is displayed along one angle from the circle center to edge.
Fig. 8.
Fig. 8.
Clustering of IPAs for TCGA GBM. Each column corresponds to a single sample, and each row to a biomolecular entity. Color bars beneath the hierarchical clustering tree denote clusters used for Figure 9.
Fig. 9.
Fig. 9.
Kaplan-Meier survival plots for the clusters from Figure 8.

Similar articles

Cited by

References

    1. Alizadeh AA, et al. Distinct types of diffuse large B-cell lymphoma identified by gene expression profiling. Nature. 2000;403:503–511. - PubMed
    1. Allison DB, et al. Microarray data analysis: from disarray to consolidation and consensus. Nat. Rev. Genet. 2006;7:55–65. - PubMed
    1. Ashburner M, et al. Gene ontology: tool for the unification of biology. the gene ontology consortium. Nat. Genet. 2000;25:25–29. - PMC - PubMed
    1. Beer MA, Tavazoie S. Predicting gene expression from sequence. Cell. 2004;117:185–198. - PubMed
    1. BioPAX working group. BioPAX–biological pathways exchange language. Documentation. 2004

Publication types