

A spectral graph theoretic approach to quantification and calibration of collective morphological differences in cell images
- PMID: 20529919
- PMCID: PMC2881379
- DOI: 10.1093/bioinformatics/btq194
A spectral graph theoretic approach to quantification and calibration of collective morphological differences in cell images
Abstract
Motivation: High-throughput image-based assay technologies can rapidly produce a large number of cell images for drug screening, but data analysis is still a major bottleneck that limits their utility. Quantifying a wide variety of morphological differences observed in cell images under different drug influences is still a challenging task because the result can be highly sensitive to sampling and noise.
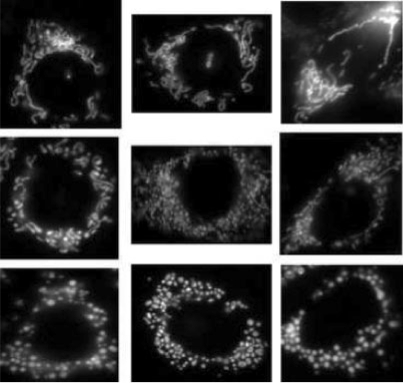
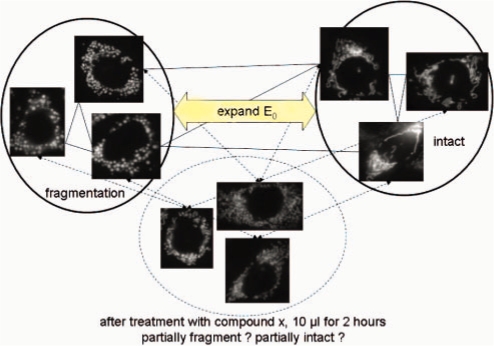
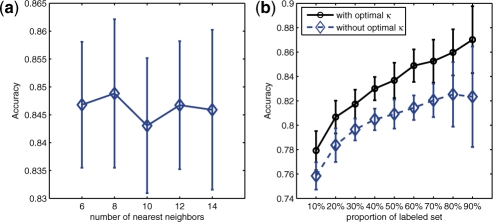
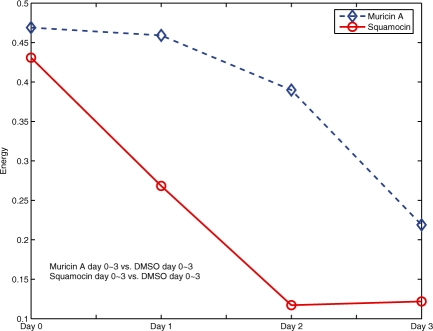
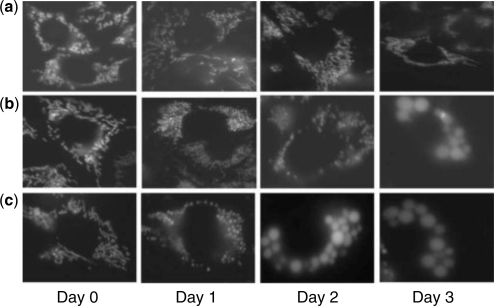
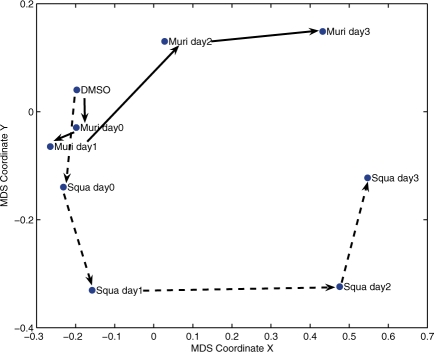
Results: We propose a graph-based approach to cell image analysis. We define graph transition energy to quantify morphological differences between image sets. A spectral graph theoretic regularization is applied to transform the feature space based on training examples of extremely different images to calibrate the quantification. Calibration is essential for a practical quantification method because we need to measure the confidence of the quantification. We applied our method to quantify the degree of partial fragmentation of mitochondria in collections of fluorescent cell images. We show that with transformation, the quantification can be more accurate and sensitive than that without transformation. We also show that our method outperforms competing methods, including neighbourhood component analysis and the multi-variate drug profiling method by Loo et al. We illustrate its utility with a study of Annonaceous acetogenins, a family of compounds with drug potential. Our result reveals that squamocin induces more fragmented mitochondria than muricin A.
Availability: Mitochondrial cell images, their corresponding feature sets (SSLF and WSLF) and the source code of our proposed method are available at http://aiia.iis.sinica.edu.tw/.
Supplementary information: Supplementary data are available at Bioinformatics online.
Figures
Similar articles
-
Boosting multiclass learning with repeating codes and weak detectors for protein subcellular localization.Bioinformatics. 2007 Dec 15;23(24):3374-81. doi: 10.1093/bioinformatics/btm497. Epub 2007 Oct 22. Bioinformatics. 2007. PMID: 17956879
-
FogBank: a single cell segmentation across multiple cell lines and image modalities.BMC Bioinformatics. 2014 Dec 30;15(1):431. doi: 10.1186/s12859-014-0431-x. BMC Bioinformatics. 2014. PMID: 25547324 Free PMC article.
-
Assessing the functional coherence of gene sets with metrics based on the Gene Ontology graph.Bioinformatics. 2010 Jun 15;26(12):i79-87. doi: 10.1093/bioinformatics/btq203. Bioinformatics. 2010. PMID: 20529941 Free PMC article.
-
Improving gene quantification by adjustable spot-image restoration.Bioinformatics. 2007 Sep 1;23(17):2265-72. doi: 10.1093/bioinformatics/btm337. Epub 2007 Jun 28. Bioinformatics. 2007. PMID: 17599935
-
Quantitative multi-image analysis in metals research.MRS Commun. 2022;12(6):1030-1036. doi: 10.1557/s43579-022-00265-7. Epub 2022 Oct 14. MRS Commun. 2022. PMID: 36474648 Free PMC article. Review.
Cited by
-
Ranking of multidimensional drug profiling data by fractional-adjusted bi-partitional scores.Bioinformatics. 2012 Jun 15;28(12):i106-14. doi: 10.1093/bioinformatics/bts232. Bioinformatics. 2012. PMID: 22689749 Free PMC article.
-
Recent advances in morphological cell image analysis.Comput Math Methods Med. 2012;2012:101536. doi: 10.1155/2012/101536. Epub 2012 Jan 9. Comput Math Methods Med. 2012. PMID: 22272215 Free PMC article. Review.
-
MitoLoc: A method for the simultaneous quantification of mitochondrial network morphology and membrane potential in single cells.Mitochondrion. 2015 Sep;24:77-86. doi: 10.1016/j.mito.2015.07.001. Epub 2015 Jul 13. Mitochondrion. 2015. PMID: 26184437 Free PMC article.
References
-
- Azran A, Ghahramani Z. ICML '06: Proceedings of the 23rd international conference on Machine learning. New York, NY, USA: ACM; 2006. A new approach to data driven clustering; pp. 57–64.
-
- Belkin M, Niyogi P. Laplacian eigenmaps for dimensionality reduction and data representation. Neur. Comput. 2003a;15:1373–1396.
-
- Belkin M, Niyogi P. Advances in Neural Information Processing Systems 15 (NIPS*2002). Cambridge, MA: MIT Press; 2003b. Using manifold stucture for partially labeled classification; pp. 929–936.
-
- Borgwardt KM, et al. Protein function prediction via graph kernels. Bioinformatics. 2005;21(suppl. 1):47–56. - PubMed
