. 2010 Jun 15;26(12):i38-46.
doi: 10.1093/bioinformatics/btq212.

Automatic reconstruction of 3D neuron structures using a graph-augmented deformable model

Affiliations

Automatic reconstruction of 3D neuron structures using a graph-augmented deformable model

Hanchuan Peng et al. Bioinformatics. .

Abstract

Motivation: Digital reconstruction of 3D neuron structures is an important step toward reverse engineering the wiring and functions of a brain. However, despite a number of existing studies, this task is still challenging, especially when a 3D microscopic image has low single-to-noise ratio and discontinued segments of neurite patterns.

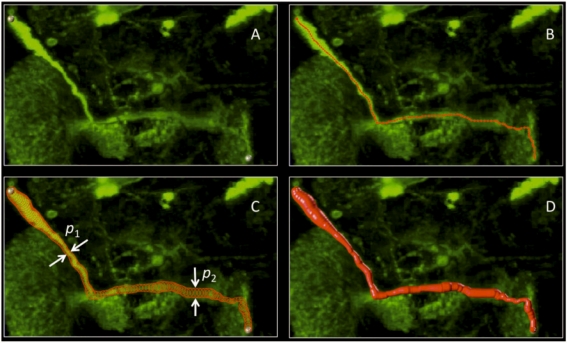
Results: We developed a graph-augmented deformable model (GD) to reconstruct (trace) the 3D structure of a neuron when it has a broken structure and/or fuzzy boundary. We formulated a variational problem using the geodesic shortest path, which is defined as a combination of Euclidean distance, exponent of inverse intensity of pixels along the path and closeness to local centers of image intensity distribution. We solved it in two steps. We first used a shortest path graph algorithm to guarantee that we find the global optimal solution of this step. Then we optimized a discrete deformable curve model to achieve visually more satisfactory reconstructions. Within our framework, it is also easy to define an optional prior curve that reflects the domain knowledge of a user. We investigated the performance of our method using a number of challenging 3D neuronal image datasets of different model organisms including fruit fly, Caenorhabditis elegans, and mouse. In our experiments, the GD method outperformed several comparison methods in reconstruction accuracy, consistency, robustness and speed. We further used GD in two real applications, namely cataloging neurite morphology of fruit fly to build a 3D 'standard' digital neurite atlas, and estimating the synaptic bouton density along the axons for a mouse brain.

Availability: The software is provided as part of the V3D-Neuron 1.0 package freely available at http://penglab.janelia.org/proj/v3d.


Figures

Fig. 1.
Fig. 1.
Examples of highly punctuated neurites, that have broken and often fuzzy structures and low single-to-noise ratio and their 3D reconstructions. (a) A single lamina neuron of fruit fly (G. Rubin laboratory) along with the 3D reconstruction. In the input image (A and C) the fruit fly neuron has broken and punctuated neurites. We applied the GD method to trace the neuron morphology (B and D) segment by segment (color-coded neurite models). (b) Punctuated axon (MEC::YFP) of C.elegans (A) (Chelur et al., 2002), along with the GD tracing (B). (c) Multiaxon staining (A) of a mouse brain region (S. Sternson laboratory), which displays punctuated structures including synaptic boutons, along with GD reconstructions of several user-specified neurites (B).
Fig. 2.
Fig. 2.
(A) Reconstruction of a neurite tract in a 3D confocal image of fruit fly brain. The skeleton (B) and the estimated width (C) are assembled as a digital model (D). In our formulation, this reconstruction has a smooth skeleton and represents the maximum neurite tract information with the shortest length. Since the neuronal pattern in (A) is broad, the haze regions make it hard to trace the skeleton in (B and D). The GD method overcomes this problem by specifying a pair of endnodes [two spheres in (A)], or using other ways to incorporate a user's prior knowledge, as global cues to guide tracing.
Fig. 3.
Fig. 3.
The edge lookup table for creating the shortest path finding graph.
Fig. 4.
Fig. 4.
Comparison of automatic GD reconstructions and manual reconstructions. (a) Visualizing the GD reconstruction and two independent manual reconstructions (N1, N2) using Neurolucida. Location pointers A–G indicate where GD significantly outperforms manual tracing. For clearer visualization, only the skeletons of traced neurites are displayed on top of the raw image. (b) SSD scores (in voxels) for the manual reconstructions compared to those between GD results and the respective best-matching manual reconstructions (i.e. SSD (N*, GD)=min{SSD (N1, GD), SSD (N2, GD)}.
Fig. 5.
Fig. 5.
Comparison of GD and NeuronStudio using synthetic images of different broken and fuzzy levels. For NeuronStudio, we used its default setting. Since a NeuronStudio tracing in most cases did not return a complete structure, we repeated multiple times at different seed locations to produce an as complete as possible reconstruction. For GD, we used the same set of seed locations in all tests. GD segments were color coded for better visualization.
Fig. 6.
Fig. 6.
Reconstruction and cataloging neuronal GAL4 patterns (AE) of a fruit fly brain, and the 3D digital atlas of neurite patterns (F). In A–E, the space-filling models of the GAL4 patterns are displayed, where the width correspond to the thickness of a neurite tract or the estimated spanning range of the arborization. In F, for clearer visualization, only skeletons of the five GAL4 patterns are shown.
Fig. 7.
Fig. 7.
Reconstruction of axon tracts in a mouse brain and estimation of putative bouton (P-site) density along axons. (A) 3D view of a database of 1006 automatically traced and manually verified axons tracts. The small dot at the tip of a tract indicates where the tract starts. (B) Two axon tracts (cyan and red) overlaid on the raw image. Green: bright P-sites. Yellow: dark P-sites that would be easy to miss if the neurite tract was not considered. (C) Histogram of P-site density of all axon tracts.

References

    1. Al-Kofahi K, et al. Rapid automated three-dimensional tracing of neurons from confocal image stacks. IEEE Trans. Inform. Technol. Biomedicine. 2002;6:171–187. - PubMed
    1. Al-Kofahi K, et al. Median-based robust algorithms for tracing neurons from noisy confocal microscope images. IEEE Trans. Inform. Technol. Biomedicine. 2003;7:302–317. - PubMed
    1. Chelur DS, et al. The mechanosensory protein MEC-6 is a subunit of the C. elegans touch-cell degenerin channel. Nature. 2002;420:669–673. - PubMed
    1. Dijkstra EW. A note on two problems in connexion with graphs. Numerische Mathematik. 1959;1:269–271.
    1. Meijering E, et al. Design and validation of a tool for neurite tracing and analysis in fluorescence microscopy images. Cytometry. 2004;58A:167–176. - PubMed

Publication types