. 2010 Jul 1;185(1):560-8.
doi: 10.4049/jimmunol.1000432. Epub 2010 Jun 7.

CD8+ T cells specific for immunodominant trans-sialidase epitopes contribute to control of Trypanosoma cruzi infection but are not required for resistance

Affiliations

CD8+ T cells specific for immunodominant trans-sialidase epitopes contribute to control of Trypanosoma cruzi infection but are not required for resistance

Charles S Rosenberg et al. J Immunol. .

Abstract

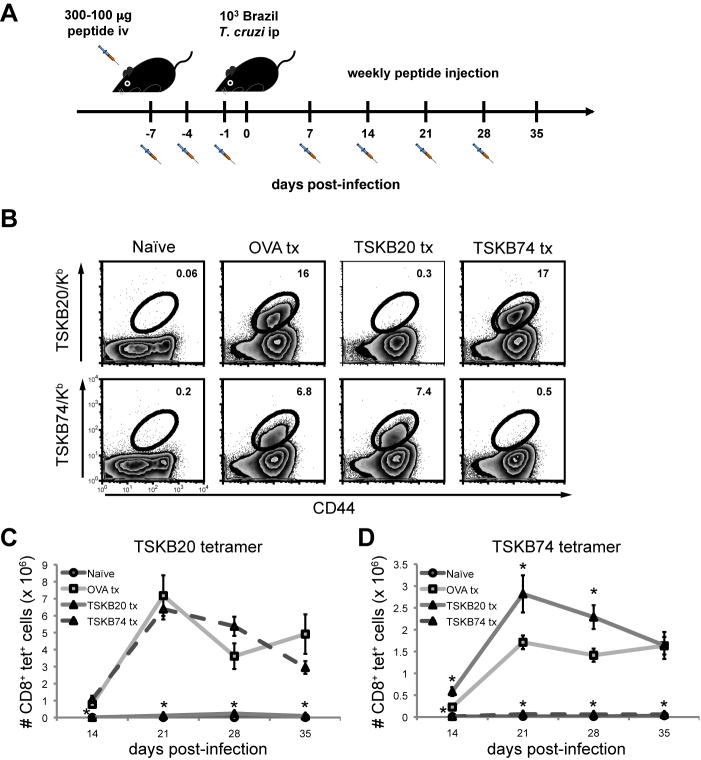
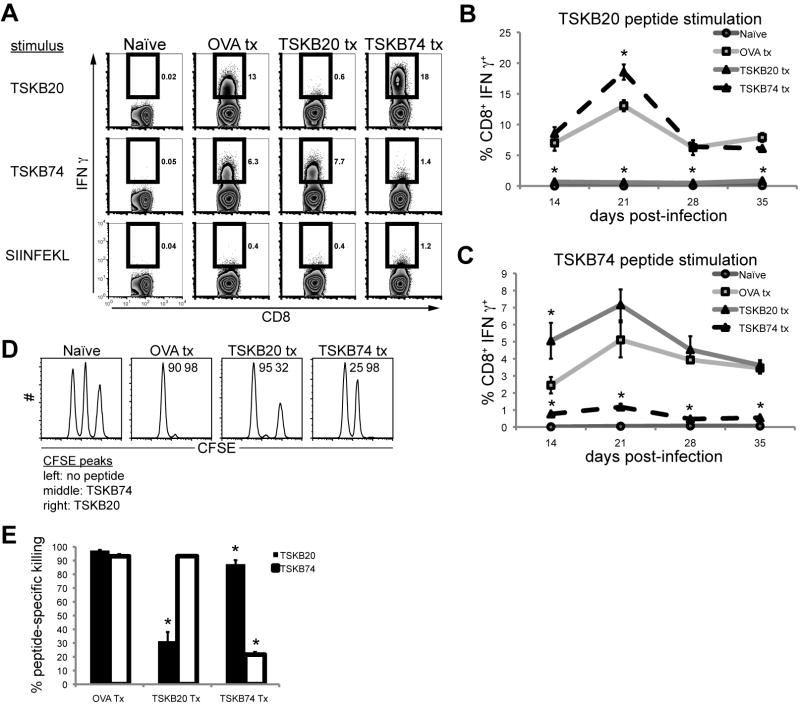
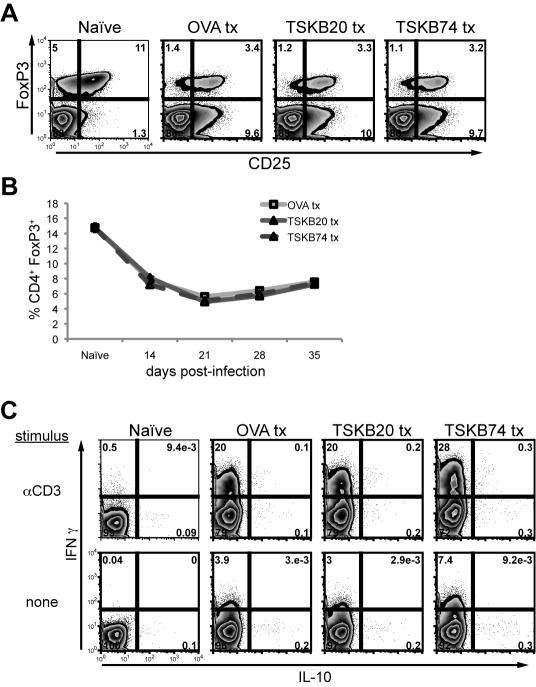
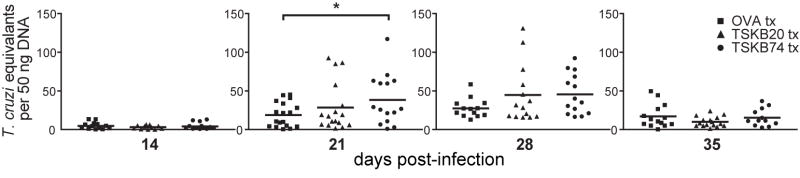
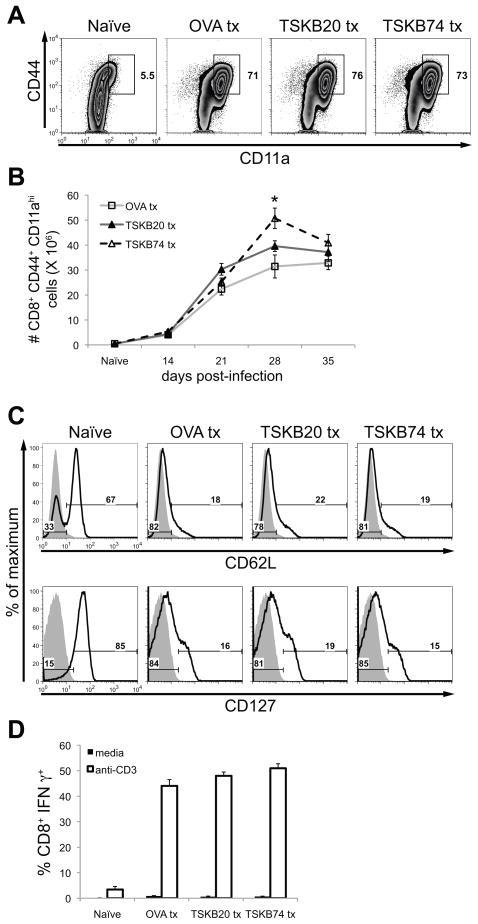
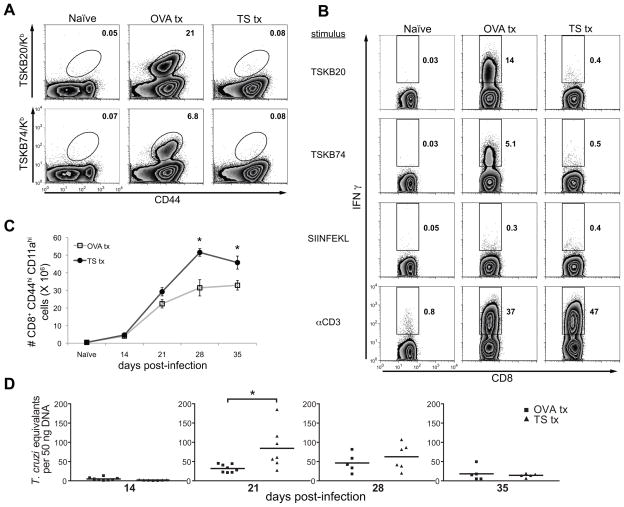
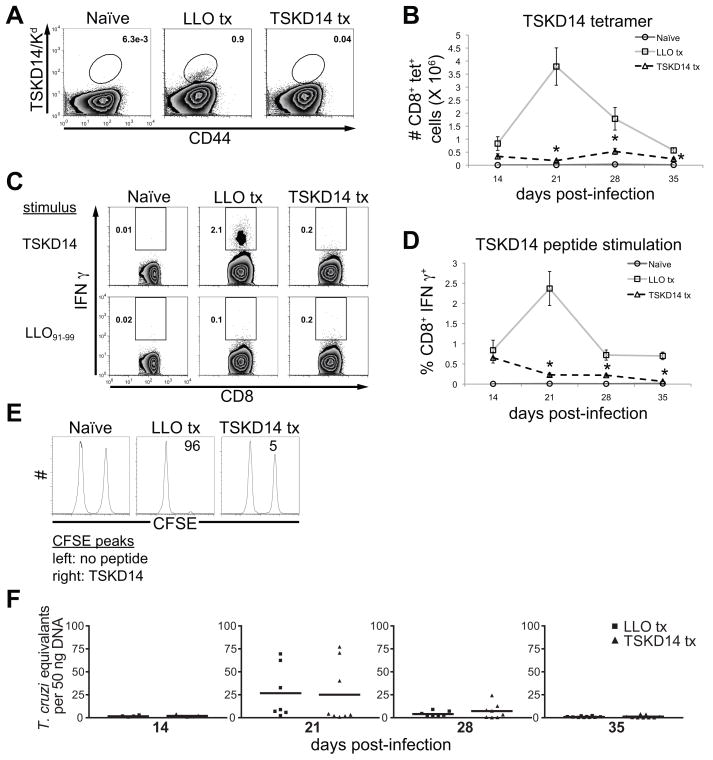
CD8(+) T cells are essential for controlling Trypanosoma cruzi infection. During Brazil strain infection, C57BL/6 mice expand parasite-specific CD8(+) T cells recognizing the dominant TSKB20 (ANYKFTLV) and subdominant TSKB74 (VNYDFTLV) trans-sialidase gene (TS)-encoded epitopes with up to 40% of all CD8(+) T cells specific for these epitopes. Although this is one of the largest immunodominant T cell responses described for any infection, most mice fail to clear T. cruzi and subsequently develop chronic disease. To determine if immunodominant TS-specific CD8(+) T cells are necessary for resistance to infection, we epitope-tolerized mice by high-dose i.v. injections of TSKB20 or TSKB74 peptides. Tolerance induction led to deletion of TS-specific CD8(+) T cells but did not prevent the expansion of other effector CD8(+) T cell populations. Mice tolerized against either TSKB20 or TSKB74, or both epitopes simultaneously, exhibited transient increases in parasite loads, although ultimately they controlled the acute infection. Furthermore, BALB/c mice tolerized against the TSKD14 peptide effectively controlled acute T. cruzi infection. These data are consistent with the hypothesis that development of high-frequency CD8(+) T cell populations focused on TS-derived epitopes contributes to optimal control of acute infection but is not required for the development of immune resistance.


Figures

Figure 1
Figure 1. Repetitive intravenous administration of peptide depletes epitope-specific CD8+ T cells during acute T. cruzi infection
(A) Protocol used to induce epitope-specific tolerance using high-dose peptide administration. Mice were injected with 100 μl peptide on indicated days before and after infection with 1,000 Brazil trypomastigotes. The primary injection was with 300 μg peptide and 100 μg was administered in the following treatments. Tolerized mice were allowed to rest for 7 days after final treatment before the experimental endpoint. Spleens of peptide-treated mice were assayed for the presence of epitope-specific CD8+ T cells at 21 days post-infection with Brazil strain T. cruzi. (B) Splenocytes from OVA257-264-, TSKB20-, and TSKB74-treated B6 mice were stained for CD44 and TSKB20/Kb or TSKB74/Kb tetramers. Histograms are gated on CD8+ cells that were CD4 CD11b B220. Numbers indicate percentage of tetramer+ cells of total CD8+ T cells. Data are from individual mice and are representative of five experiments. The total numbers of TSKB20/Kb (C) or TSKB74/Kb (D) CD8+ T cells per spleen were calculated. Data are mean ± SEM and are cumulative from 3 separate experiments (n=4–11 per group). *, p<0.05 compared to OVA Tx group.
Figure 2
Figure 2. Peptide tolerized mice lack epitope-specific CD8+ T cell effector functions
Peptide-treated mice were assayed for epitope-specific effector functions during acute T. cruzi infection. Splenocytes were incubated for 5 hours in the presence of 1 μM peptide and brefeldin A. (A) Representative intracellular IFNγ staining at 21 days post-infection. Histograms are gated on CD8+ CD4 lymphocytes and numbers indicate percentage of cytokine-producing CD8+ T cells. Data are from individual mice and are representative of five experiments. The percentage of CD8+ T cells producing IFNγ in response to (B) TSKB20- or (C) TSKB74-peptide stimulation over the course of acute infection. Data are mean ± SEM from 1 experiment (n=4–5 per group) and are representative of five experiments. *, p<0.05 compared to OVA Tx group. Naïve splenocytes were pulsed with 1 μM TSKB20, 1 μM TSKB74, or no peptide and then labeled with high, medium, or low concentrations of CFSE, respectfully. At 28 days post-infection, equal numbers of each population were co-transferred ip into mice then detected in the spleens after 16 hours. Numbers indicate the percentage of specific lysis measured for individual mice. (E) Data are mean ± SEM and are cumulative of two in vivo CTL experiments (n=6–7 per group). *, p<0.05 compared to OVA Tx group.
Figure 3
Figure 3. Peptide induced tolerance does not enhance regulatory T cell populations
Tolerized mice were monitored for regulatory T cell populations (A–B) as well as IL-10 production (C) during infection. (A) Representative intracellular staining for the FoxP3 transcription factor at 21 days post-infection. Histograms are gated on CD4+, and were co-stained with CD25. Numbers indicate the percentage of cells in each quadrant. (B) The percentage of FoxP3 expressing CD4+ T cells in spleens over the course of infection. Data are mean ± SEM from 2 experiments (n=3–12 per group). Splenocytes were incubated for 5 hours in media alone or with plate-bound mouse-CD3 monoclonal antibody in the presence of brefeldin A. Histograms are gated on CD4+ CD8 cells, and numbers indicate the percentage of IL-10 and/or IFNγ positive cells per quadrant. Data are from individual mice and are representative of three experiments.
Figure 4
Figure 4. Mice tolerized against immunodominant T. cruzi epitopes control acute infection
The quantity of T. cruzi DNA in skeletal muscle of peptide-treated mice was detected at indicated time points by real-time PCR. Data points are for individual mice and bars are the mean from five experiments (n=11–17 per group). Several individuals were removed from the analysis because they passed the Grubbs’ outlier test (GraphPad software). *, p<0.05.
Figure 5
Figure 5. Tolerized mice generate normal effector CD8+ T cell populations despite the absence of immunodominant CD8+ T cells
Spleens of peptide-treated mice were assayed for the presence of antigen-experienced effector CD8+ T cells. (A) Representative staining for CD44 and CD11a expression at 21 days post-infection. Histograms are gated on CD8+ cells that were CD4 CD11b B220. Similar results were obtained in three separate experiments. (B) The total number of CD44hi CD11ahi CD8+ T cells per spleen was calculated. Data are mean ± SEM from one experiment (n=4–5 per group). *, p<0.05 compared to the OVA Tx group. (C) Representative staining for CD62L and CD127 at 21 days post-infection. Histograms are gated on CD8+ cells that were CD4 CD11b B220. Numbers indicate the percentage of CD8+ T cells that have lost (left) or retained (right) expression of each marker (bold lines). Shaded lines are a fluorescence-minus-one control for the indicated marker. Similar results were obtained in three separate experiments. (D) Splenocytes were incubated for five hours in media alone or with plate-bound mouse-CD3 monoclonal antibody in the presence of brefeldin A at 35 days post-infection. Data are the mean (± SEM) percentage of CD8+ T cells producing IFNγ for each condition (n=3–17 per group from three separate experiments). The percentage of CD8+ T cells capable of producing IFNγ was also similar between groups at 14, 21, and 28 days post-infection (data not shown).
Figure 6
Figure 6. Mice tolerant to both TSKB20 and TSKB74 are ultimately resistant to T. cruzi infection
B6 mice were injected with both TSKB20 and TSKB74 peptides (TS tx) similar to the description in Fig. 1A. TS Tx mice received the same total quantity of peptide as OVA Tx mice, i.e. half the effective dose of each individual peptide compared to experiments described in Fig. 1–5. (A) Representative tetramer staining at 21 days post-infection. Histograms are gated on CD8+ cells that were CD4 CD11b B220. Numbers indicate percentage of tetramer+ cells out of CD8+ T cells. Data are from individual mice and are representative of five experiments. (B) Representative intracellular staining for IFNγ produced in response to the indicated stimulus (see Materials and Methods). Histograms are gated on CD8+ CD4 cells. Numbers indicate percentage of IFNγ+ CD8+ T cells. (C) The total number of CD44hi CD11ahi CD8+ T cells per spleen was calculated. Data are mean ± SEM from one experiment (n=3–5 per group). *, p<0.05 compared to the OVA Tx group (same control individuals as in Fig 5B). (D) Quantity of T. cruzi DNA in skeletal muscle of peptide-treated mice detected by real-time PCR. Data points are individual mice and bars are the mean from two experiments (n=5–8 per group). One individual outlier was removed from the analysis. *, p<0.05.
Figure 7
Figure 7. TSKD14 tolerized BALB/c mice remain resistant to T. cruzi infection
BALB/c mice were treated with H-2Kd-restricted TSKD14 or LLO91-99 peptide as described in Fig. 1A. (A) Splenocytes from TSKD14- or LL091-99-treated BALB/c mice were stained for CD44 and TSKD14/Kd. Histograms are gated on CD8+ cells that were CD4 CD11b B220. Numbers indicate percentage of tetramer+ cells of total CD8+ T cells. Data are from individual mice and are representative of three experiments. (B) The total number of TSKD14/Kd CD8+ T cells per spleen. Data are mean ± SEM and are cumulative from one experiment (n=4–5 per group). *, p<0.05 compared to LLO Tx group. (C) Representative intracellular staining for IFNγ produced in response to TSKD14 or LL091-99 peptide stimulation. Histograms are gated on CD8+ CD4 cells. (D) The percentage of IFNγ producing CD8+ T cells specific for TSKD14 during acute infection. Data are mean ± SEM from two experiments (n=4–11 per group). *, p<0.05 compared to LLO Tx group. (E) TSKD14-specific in vivo cytotoxicity at 28 days post-infection. (F) Quantity of T. cruzi DNA in skeletal muscle of peptide-treated mice detected by real-time PCR. Data points are individual mice and bars are the mean from two experiments (n=4–10 per group). Several individuals were removed from the analysis because they passed the Grubbs’ outlier test (GraphPad software).

Similar articles

Cited by

References

    1. Wong P, Pamer EG. CD8 T cell responses to infectious pathogens. Annu Rev Immunol. 2003;21:29–70. - PubMed
    1. Harty JT, Tvinnereim AR, White DW. CD8+ T cell effector mechanisms in resistance to infection. Annu Rev Immunol. 2000;18:275–308. - PubMed
    1. Yewdell JW, Bennink JR. Immunodominance in major histocompatibility complex class I-restricted T lymphocyte responses. Annu Rev Immunol. 1999;17:51–88. - PubMed
    1. Pamer EG. Immune responses to Listeria monocytogenes. Nat Rev Immunol. 2004;4:812–823. - PubMed
    1. Yewdell JW. Confronting complexity: real-world immunodominance in antiviral CD8+ T cell responses. Immunity. 2006;25:533–543. - PubMed

Publication types

MeSH terms