. 2010 Aug 13;285(33):25602-12.
doi: 10.1074/jbc.M110.135483. Epub 2010 Jun 8.

Activity-based protein profiling identifies a host enzyme, carboxylesterase 1, which is differentially active during hepatitis C virus replication

Affiliations

Activity-based protein profiling identifies a host enzyme, carboxylesterase 1, which is differentially active during hepatitis C virus replication

David R Blais et al. J Biol Chem. .

Abstract

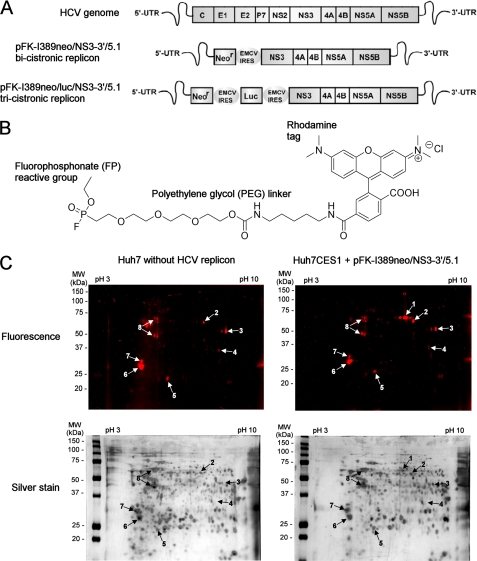
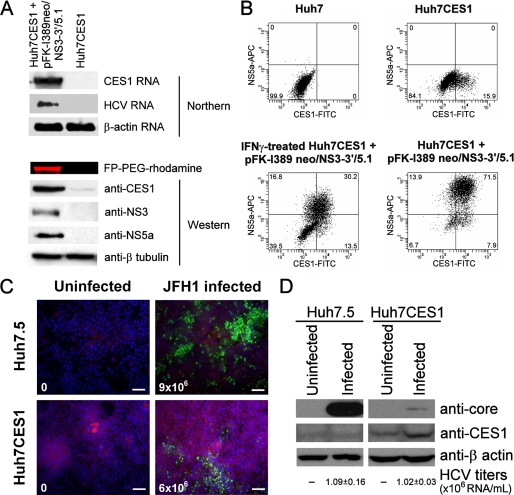
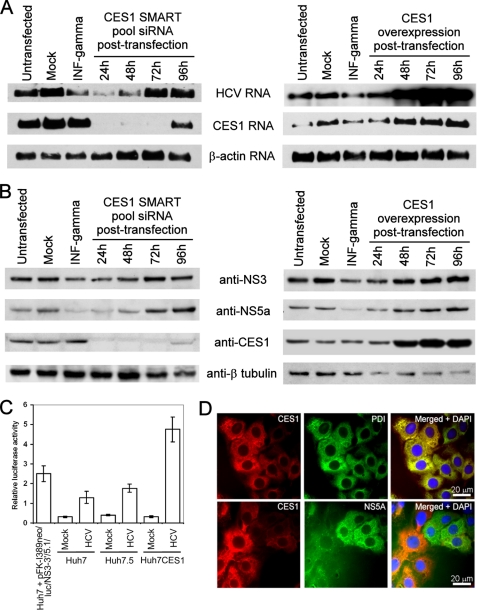
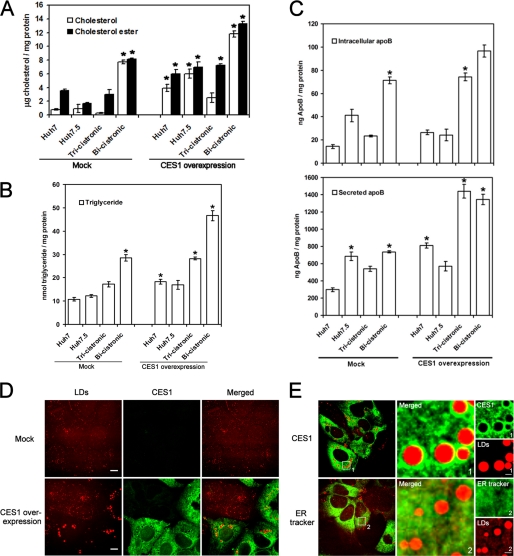
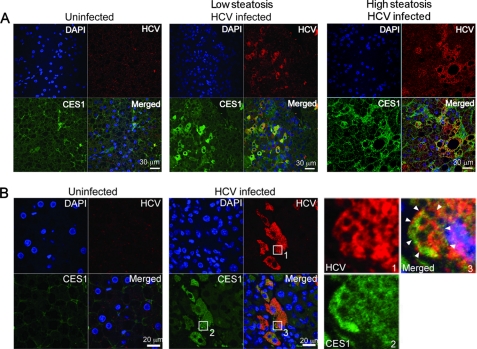
Hepatitis C virus (HCV) relies on many interactions with host cell proteins for propagation. Successful HCV infection also requires enzymatic activity of host cell enzymes for key post-translational modifications. To identify such enzymes, we have applied activity-based protein profiling to examine the activity of serine hydrolases during HCV replication. Profiling of hydrolases in Huh7 cells replicating HCV identified CES1 (carboxylesterase 1) as a differentially active enzyme. CES1 is an endogenous liver protein involved in processing of triglycerides and cholesterol. We observe that CES1 expression and activity were altered in the presence of HCV. The knockdown of CES1 with siRNA resulted in lower levels of HCV replication, and up-regulation of CES1 was observed to favor HCV propagation, implying an important role for this host cell protein. Experiments in HCV JFH1-infected cells suggest that CES1 facilitates HCV release because less intracellular HCV core protein was observed, whereas HCV titers remained high. CES1 activity was observed to increase the size and density of lipid droplets, which are necessary for the maturation of very low density lipoproteins, one of the likely vehicles for HCV release. In transgenic mice containing human-mouse chimeric livers, HCV infection also correlates with higher levels of endogenous CES1, providing further evidence that CES1 has an important role in HCV propagation.


Figures

FIGURE 1.
FIGURE 1.
Activity specific labeling of serine hydrolases with the FP-PEG-rhodamine probe in hepatoma cells replicating HCV identifies CES1 as a differentially active enzyme. A, schematic representations of the HCV genome and the bicistronic (pFK-I389neo/NS3-3′/5.1) and tricistronic (pFK-I389neo/luc/NS3-3′/5.1) subgenomic replicon variants used in this study (NS, non-structural proteins). B, chemical structure of the FP-PEG-rhodamine probe. C, the active proteome isolated from naive Huh7 cells or a unique Huh7CES1 hepatoma cell line stably expressing the pFK-I389neo/NS3-3′/5.1 replicon was labeled in vitro for 1 h at 37 °C with 1 nm FP-PEG-rhodamine probe (n = 3). After separation of the proteomes by two-dimensional gel electrophoresis, the fluorescence-tagged proteins, indicated with arrows, were identified by liquid chromatography-MS/MS (supplemental Table S1). UTR, untranslated region.
FIGURE 2.
FIGURE 2.
CES1 modulates JFH1 HCV infection in cured Huh7CES1 cells. A, pFK-I389neo/NS3-3′/5.1-bearing Huh7CES1 cells were cured with NS5B-6367 siRNA (33) for 2 weeks, followed by IFNγ treatment (200 units/ml) for 2 months, leading to the isolation of a clonal cell line referred to as Huh7CES1 cells. The cellular proteome was analyzed by Northern blotting against HCV and β-actin as well as Western blotting using anti-CES1, anti-NS3, anti-NS5A, and anti β-tubulin antibodies. B, representative flow cytometry analysis used to monitor CES1 and NS5A expression in various cell lines. The Huh7.5 and pFK-I389neo/luc/NS3-3′/5.1 replicon cell FACS profiles (not shown) were identical to that of Huh7 cells. The Huh7CES1 cells bearing pFK-I389 neo/NS3-3′/5.1 were cured by a 2-week HCV siRNA exposure followed by a 60-day IFNγ treatment (200 units/ml). The IFNγ-treated Huh7CES1 cells bearing pFK-I389 neo/NS3-3′/5.1 were subjected to a 96-h IFNγ treatment prior to FACS analysis. The numbers indicate the percentage of positive cells in each quadrant. C, Huh7.5 and cured Huh7CES1 cells were infected with 8 × 10⁴ JFH1 particles for 96 h. Immunofluorescence was subsequently performed to visualize CES1 (red) and HCV core (green) intracellular abundance. HCV titers are indicated in the lower left of each panel (scale bars, 40 μm). D, Huh7.5 and Huh7CES1 cells were infected with 8 × 10⁴ JFH1 particles for 96 h, after which intracellular core and CES1 levels were measured by Western blotting and HCV titers in the cellular media were quantified by quantitative PCR.
FIGURE 3.
FIGURE 3.
The abundance of CES1 modulates HCV replication levels in Huh7 cells. A,B, pFK-I389neo/NS3-3′/5.1 stably replicating Huh7CES1 cells were treated with non-targeting siRNA or empty overexpression vector (mock), INFγ (48h treatment), CES1 SMART pool siRNA or CES1 overexpression plasmid. Their effects on replication level were measured at different time points post-transfection by northern blotting against HCV, CES1 and β-actin (A); and by Western blotting using anti-NS3, anti-NS5A, anti-CES1 and anti β-tubulin antibodies (B). The untreated and mock control showed are representative of the RNA and protein abundance at the four time point studied during these experiments (supplemental Fig. S3, G and H). C, the replication and translation of HCV RNA was measured in the indicated cell lines co-transfected with pFK-I389neo/luc/NS3-3′/5.1 HCV replicon and Renilla luciferase mRNA. Luciferase activity was measured 24 h post-transfection and normalized with Renilla luciferase activity. D, immunofluorescence detection of CES1 (red), PDI (green), and NS5A (green) proteins in pFK-I389neo/NS3-3′/5.1 replicon-containing Huh7CES1 cells.
FIGURE 4.
FIGURE 4.
CES1 surrounds LDs and increases the storage of inert lipids in LDs. A–C, cholesterol (A), triglyceride (B), and apoB (C) levels measured before and after overexpressing CES1 for 48 h in naive Huh7 and Huh7.5, as well as in cells stably expressing the subgenomic bi- and tricistronic replicons. Statistically significant differences of three independent experiments were determined using analysis of variance, with probabilities p < 0.05 (asterisk). D, Huh7 cells with basal or overexpressed CES1 levels were analyzed 48 h post-transfection with CARS and two-photon immunofluorescence microscopy to visualize lipid droplets (red) and CES1 protein (green) (scale bar, 10 μm). E, after overexpression of CES1 for 48 h in Huh7 cells, two-photon immunofluorescence microscopy was used to visualize CES1 (green) or ER tracker (green) in parallel with LD analysis (red) by CARS microscopy. Higher magnification images of areas 1 and 2 are shown in the middle and right panels (scale bar, 2 μm). Error bars, S.D.
FIGURE 5.
FIGURE 5.
HCV up-regulates CES1 expression in JFH1-infected chimeric mouse-human livers. A and B, immunofluorescence co-localization of HCV NS3/NS4A proteins (red) and CES1 (green) within JFH1 HCV-infected primary human hepatocytes transplanted in SCID Alb-uPA mice from donor A (A), and analogously for another hepatocyte donor B (B). The arrowheads in the magnified image (B), box 3, delineate HCV and CES1 proteins occupying distinct areas surrounding LDs. Only human hepatocytes are present in this figure. DAPI, 4′,6-diamidino-2-phenylindole.

Similar articles

Cited by

References

    1. Lindenbach B. D., Rice C. M. (2005) Nature 436, 933–938 - PubMed
    1. Chisari F. V. (2005) Nature 436, 930–932 - PubMed
    1. Moradpour D., Penin F., Rice C. M. (2007) Nat. Rev. Microbiol. 5, 453–463 - PubMed
    1. Sagan S. M., Rouleau Y., Leggiadro C., Supekova L., Schultz P. G., Su A. I., Pezacki J. P. (2006) Biochem. Cell Biol. 84, 67–79 - PubMed
    1. Pezacki J. P., Singaravelu R., Lyn R. K. (2010) Mol. Biosys. 6, 1131–1142 - PubMed

Publication types